Learn free · topic 200
Feature Table inML Modelling
We know what Data Science is, it is about running algorithms and machine learning models (ML models) on structured, semi and unstructured data sets for analytics.
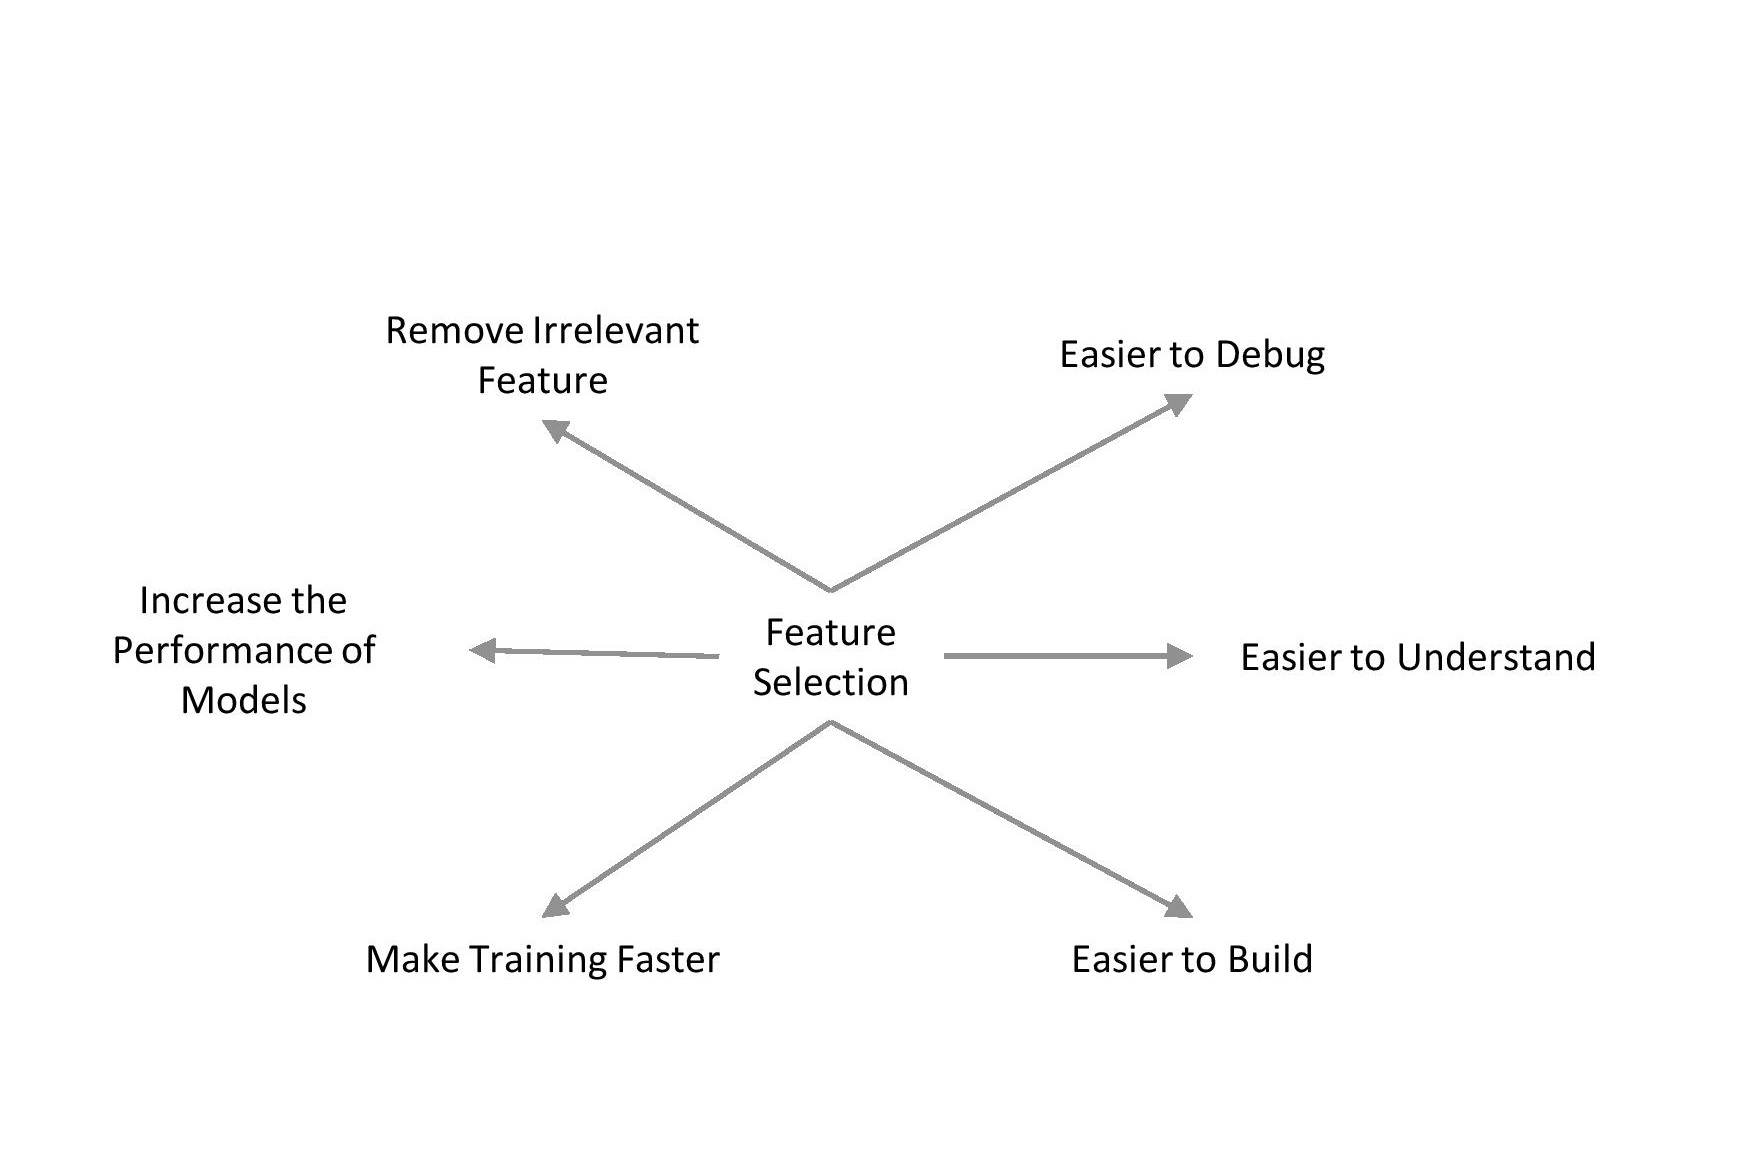
For any ML model there is a basic requirement of data, right? And we all know Data Scientists love to play with Raw Data. Now, Raw Data means irrelevant data as well, so Data Scientists need Raw BUT relevant Raw Data. In Big Data, we know data sizes are huge and to train models, one doesn’t need all Raw Data. So, what data scientists do, they themselves or ideally data engineers clean and filter the data, in other words do Data Wrangling, before feeding into ML models.
For example, there is a table with 1 million rows containing data around the globe with all kinds of customers, but ML models is supposed to predict customers buying behavior for a particular country and for a particular set of products. Means, we don’t need to feed 1 million rows to our ML model so now we will create another table (FEATURE) where we will only keep data for that country and for required set of products and now make that table as source for our ML models.
‘Feature in nothing more than a traditional Table.’
In nutshell, a new table created and populated from raw data using data wrangling (explained in separate topic) to be used as source data for Machine Learning Model is called a Feature.
Finished reading? Test yourself with 10 questions on this topic.
Go to the questions →From I Am Datapedia! by Mustafa Qizilbash, published here free by the author. Nothing about your reading is stored.