Learn free · topic 66
WHAT IS A DIMENSION Table?
A Dimension is a descriptive table in dimensional modelling that provides context to fact tables. While facts record measurable events, dimensions explain those events by supplying descriptive attributes such as names, categories, locations, and time periods. Dimensions answer questions such as who, what, when, where, and sometimes how.
The primary goal of a dimension is to make numeric measures meaningful and interpretable. Without dimensions, numbers such as LoanAmount or ApprovalCount would lack business relevance. Dimensions provide the language that business users understand.
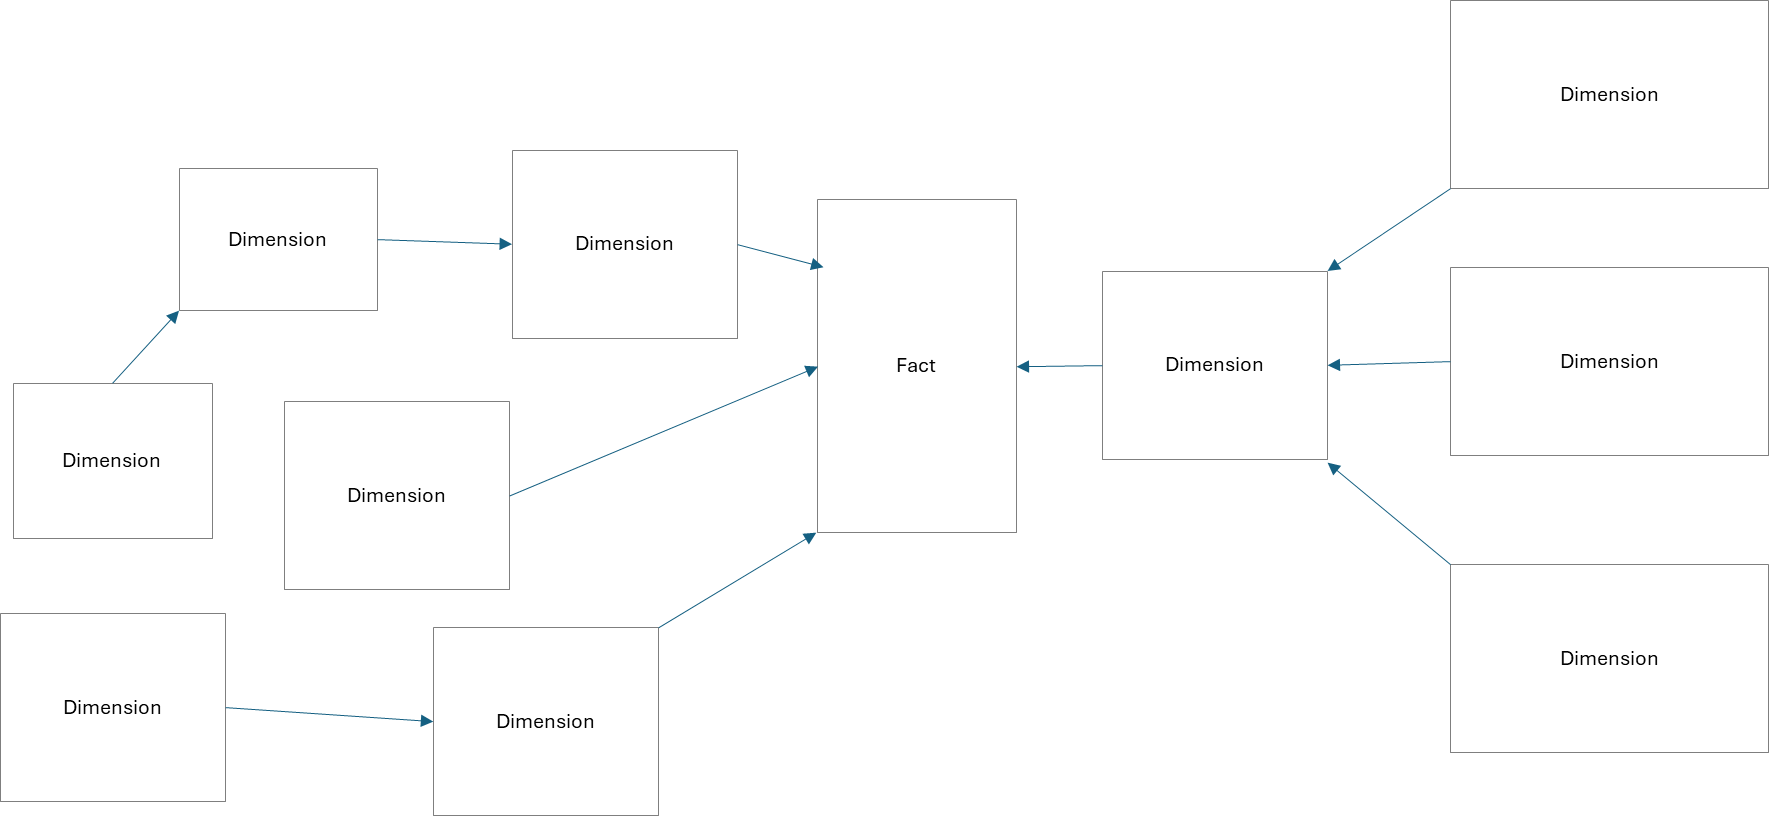
A dimension table typically contains:
- A primary key (e.g., Customer_ID, Officer_ID, Branch_ID, Time_ID)
- Descriptive attributes (e.g., Name, Segment, Region, ExperienceYears)
- Hierarchies for reporting (e.g., Day → Month → Quarter → Year)
For example, in a loan approval data warehouse:
- Dim_Customer may include CustomerID, Name, AgeGroup, IncomeBand, Segment.
- Dim_Officer may include OfficerID, Name, Branch, ExperienceYears.
- Dim_Branch may include BranchID, City, Region.
- Dim_Date may include DateID, Day, Month, Quarter, Year.
When analysts query the Fact_LoanApproval table, these dimensions allow slicing measures such as LoanAmount by customer segment, officer branch, or calendar quarter. A simple query like “Total Approved Loan Amount by Branch and Quarter” becomes possible because the fact table connects to well-defined dimensions.
Dimensions also often contain hierarchies, enabling roll-up and drill-down analysis. For instance, a Date dimension allows aggregation at daily, monthly, quarterly, or yearly levels. Similarly, a Geography hierarchy may allow analysis by City → State → Country.
Another important feature of dimensions is the management of slowly changing attributes. Business attributes such as customer segment or officer branch may change over time. Techniques such as Slowly Changing Dimensions (SCD Type 1, Type 2, or Type 3) are used to preserve historical accuracy while maintaining reporting consistency.
The strengths of dimensions lie in their usability. They make facts understandable, intuitive, and accessible to business users. They support hierarchical analysis and integrate seamlessly with BI tools. They are often described as the “face” of the data warehouse because business users primarily interact with dimension attributes when building reports.
However, there are trade-offs. Because star schemas are denormalized, dimension tables may contain redundant data. Managing slowly changing attributes requires careful governance. Poorly designed hierarchies can create inconsistent reporting results.
From a modelling perspective, dimensions are part of the Dimensional Modelling family, including Star, Snowflake, and Unified Star Schema designs. In a star schema, dimensions are denormalized for simplicity and performance. In a snowflake schema, dimensions may be partially normalized to reduce redundancy, moving slightly closer to 2NF or 3NF principles. However, dimensional modelling does not aim to comply with higher normal forms such as 4NF, 5NF, or 6NF. Its priority is usability and analytical performance.
In summary, dimensions provide the descriptive context that transforms raw numeric measures into meaningful business insight. If facts tell us what happened, dimensions explain who it happened to, when it happened, and under what conditions.
Finished reading? Test yourself with 10 questions on this topic.
Go to the questions →From I Am Datapedia! by Mustafa Qizilbash, published here free by the author. Nothing about your reading is stored.