Learn free · topic 64
DIMENSIONAL DATA MODELLING
Dimensional Data Modelling is an analytical modelling approach that structures data into facts (quantitative measures) and dimensions (descriptive attributes) to support reporting, dashboards, and business intelligence. It provides a simplified, performance-oriented representation of organizational data, making analytics accessible to both technical and business users.
The primary goal of dimensional modelling is to deliver a business-friendly and performance-optimized structure that enables fast and intuitive access to information. Rather than focusing on eliminating redundancy at all costs, dimensional modelling focuses on making data easy to query, aggregate, and understand.
Dimensional models are organized around business processes. A fact table captures measurable events, such as loan approvals, repayments, or transactions. Surrounding the fact table are dimension tables, which provide context, such as customer attributes, officer details, product types, and dates. Together, they answer two fundamental questions:
- What happened? (facts)
- Under what circumstances did it happen? (dimensions)
Two common schema patterns are used:
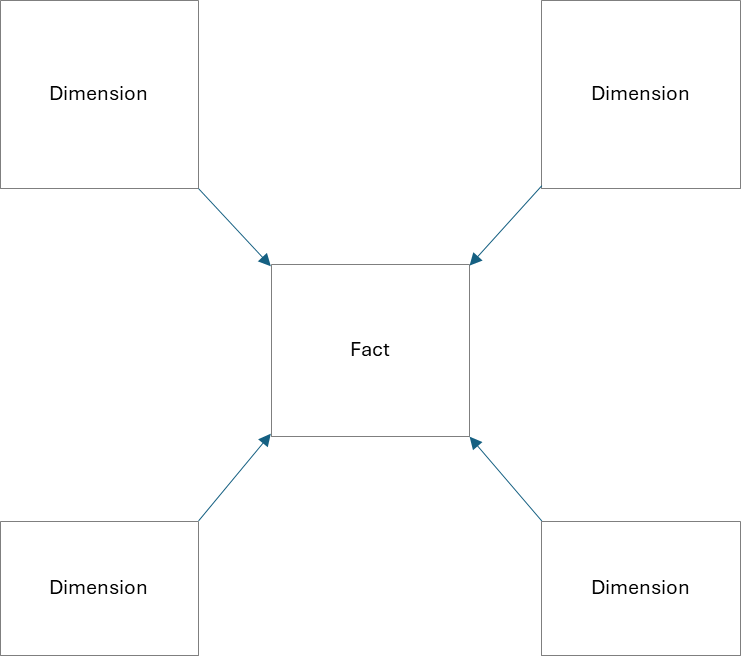
Star Schema:
The fact table connects directly to denormalized dimension tables. This produces a simple, high-performance structure with minimal joins. It is the most common dimensional design because of its clarity and speed.
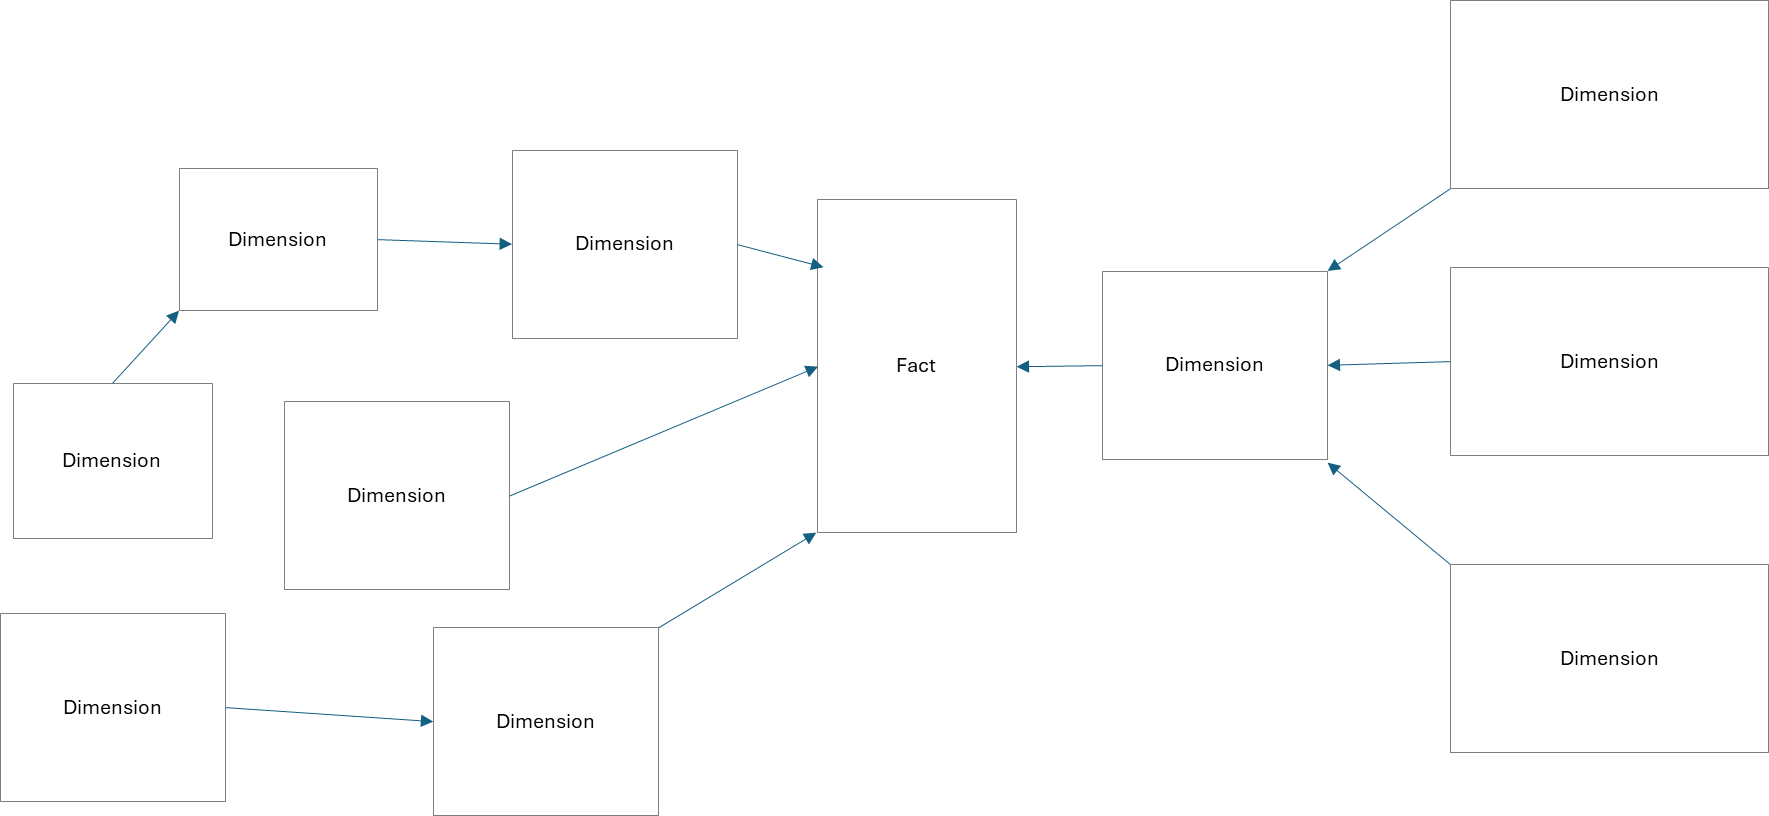
Snowflake Schema:
Dimensions are partially normalized into sub-dimensions. For example, a Customer dimension may reference a separate Geography table. This reduces redundancy but increases join complexity.
Unlike highly normalized relational models (1NF through 6NF), dimensional models intentionally denormalize data to optimize usability and query performance. Snowflake schemas reintroduce limited normalization (similar to 2NF or 3NF concepts), but full normalization compliance is not the objective. The guiding principle is simplicity for analytics.
Consider a loan approval environment. A bank may design a Fact_LoanApproval table containing measures such as LoanAmount, InterestRate, ApprovalFlag, and ApprovalCount. Surrounding dimensions may include:
- Dim_Customer (segment, age group, region)
- Dim_Officer (branch, experience level)
- Dim_Product (loan type, secured/unsecured)
- Dim_Date (day, month, quarter, year)
With this structure, business users can easily answer questions such as:
- “Total Approved Loan Amount by Customer Segment and Quarter”
- “Approval Rate by Branch and Product Type”
- “Average Interest Rate by Officer Experience Level”
These queries require straightforward joins and fast aggregations, making dimensional modelling highly compatible with BI tools and OLAP engines.
The strengths of dimensional modelling include intuitive structure, fast aggregation performance, and strong alignment with reporting needs. It scales naturally by adding new fact tables for additional processes or new dimensions for richer analysis.
However, it is less suitable for transaction processing or fine-grained operational updates. Denormalization increases redundancy and storage usage. Snowflake designs may reduce redundancy but add complexity.
From a modelling family perspective, dimensional modelling is not part of the ensemble family (which includes Data Vault, Anchor, or Focal Point). Instead, it represents an OLAP-oriented approach rooted in denormalization. It intentionally diverges from strict normalization principles in favor of performance and business usability.
In summary, dimensional modelling is a usability-first, analytics-driven technique. Facts capture measurable business events, dimensions provide descriptive context, and together they form the backbone of modern data warehouses and business intelligence systems.
Star Schema
Snowflake Schema
Finished reading? Test yourself with 10 questions on this topic.
Go to the questions →From I Am Datapedia! by Mustafa Qizilbash, published here free by the author. Nothing about your reading is stored.