Learn free · topic 175
Data Spread
We all have heard about Mean and Median values but not Spread.
- Mean: The mean (informally, the “average “) is found by adding all the numbers together and dividing by the number of items in the set: (10 + 10 + 20 + 40 + 70) / 5 = 30.
- Median: The median is found by ordering the set from lowest to highest and finding the exact middle. The median is just the middle number: 20.
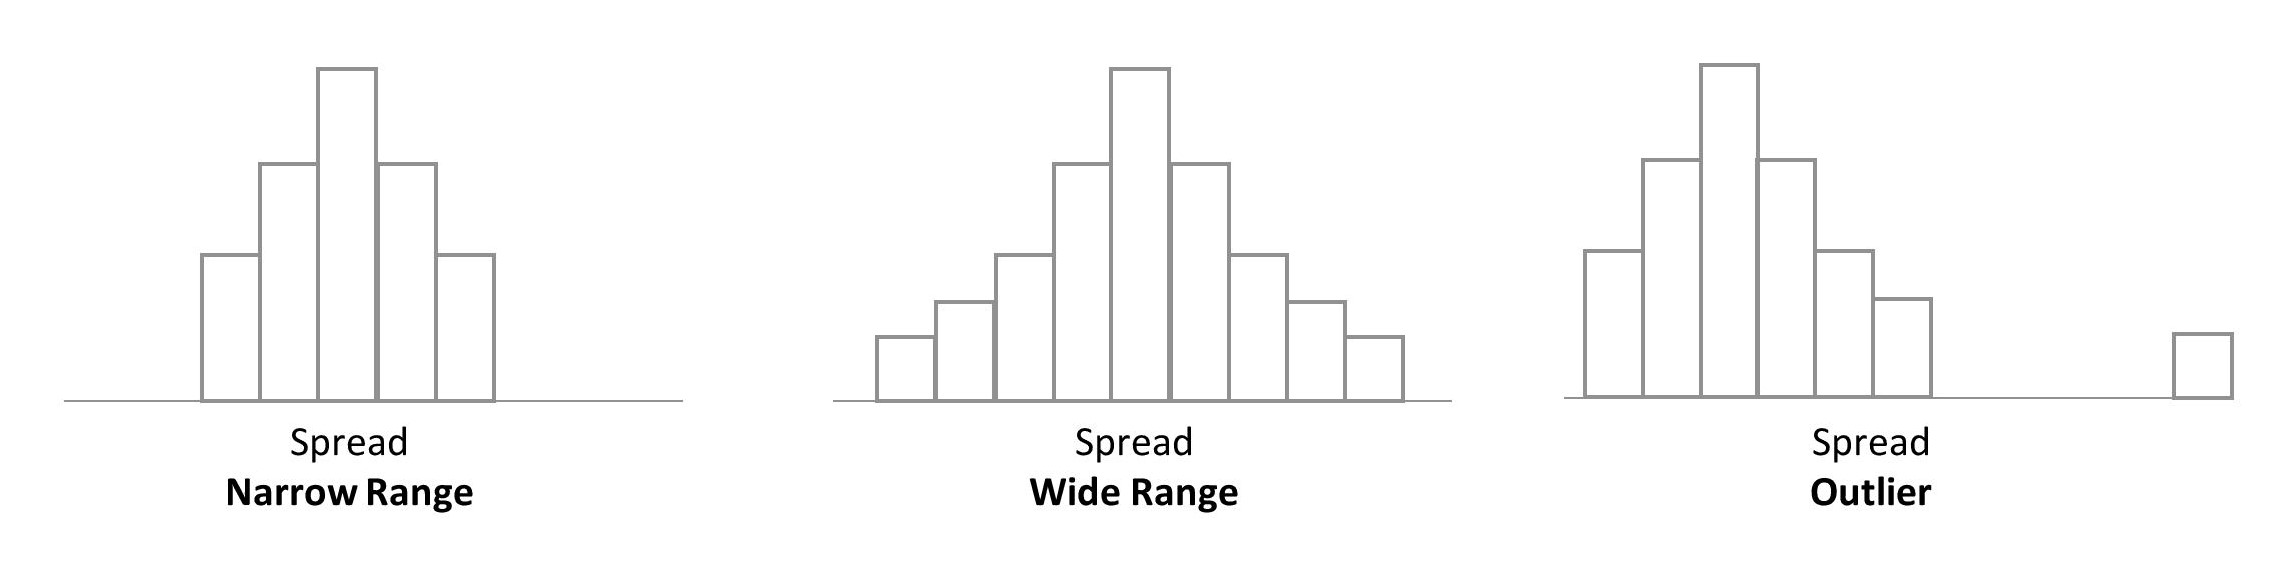
- Spread: The simple explanation of Spread is e.g., how variable the data is or how spread out the data values are in the dataset, or it is also referred to as a measure of dispersion etc., from the Mean or Median values.
Let’s try to understand with an example. Let’s say we have a dataset with the customers’ age from 20 to 60.
Breakdown
- 8 customers with Age [10]
- 15 customers with Age [20]
- 12 customers with Age [30]
- 7 customers with Age [40]
- 3 customers with Age [60]
In this dataset the Mean = 32 and Median = 30
In this dataset, in case of Mean, Data Spread are.
- 32 to 20
- 32 to 60
In this dataset, in case of Median, Data Spread are.
- 30 to 20
- 30 to 60
In social media, the content is dependent on the customer age spread, the more the age is spread the more type of content must be made. Kids under age 16 should not view content created for above age groups.
The marketing department’s analysis is also very much dependent on the data spread. The more the spread is the more the range of campaigning can be launched. The more the customers can be engaged.
Finished reading? Test yourself with 10 questions on this topic.
Go to the questions →From I Am Datapedia! by Mustafa Qizilbash, published here free by the author. Nothing about your reading is stored.