Learn free · topic 360
Graph Theory
- Computer Science: For tasks like network analysis, designing routing algorithms, indexing databases, and building AI models.
- Social Networks: To analyse relationships and influence across social media platforms.
- Biology: For mapping genetic networks and studying protein interactions.
- Transportation: To improve route planning and manage traffic flow efficiently.
- Project Management: To visualize tasks, dependencies, and project schedules.
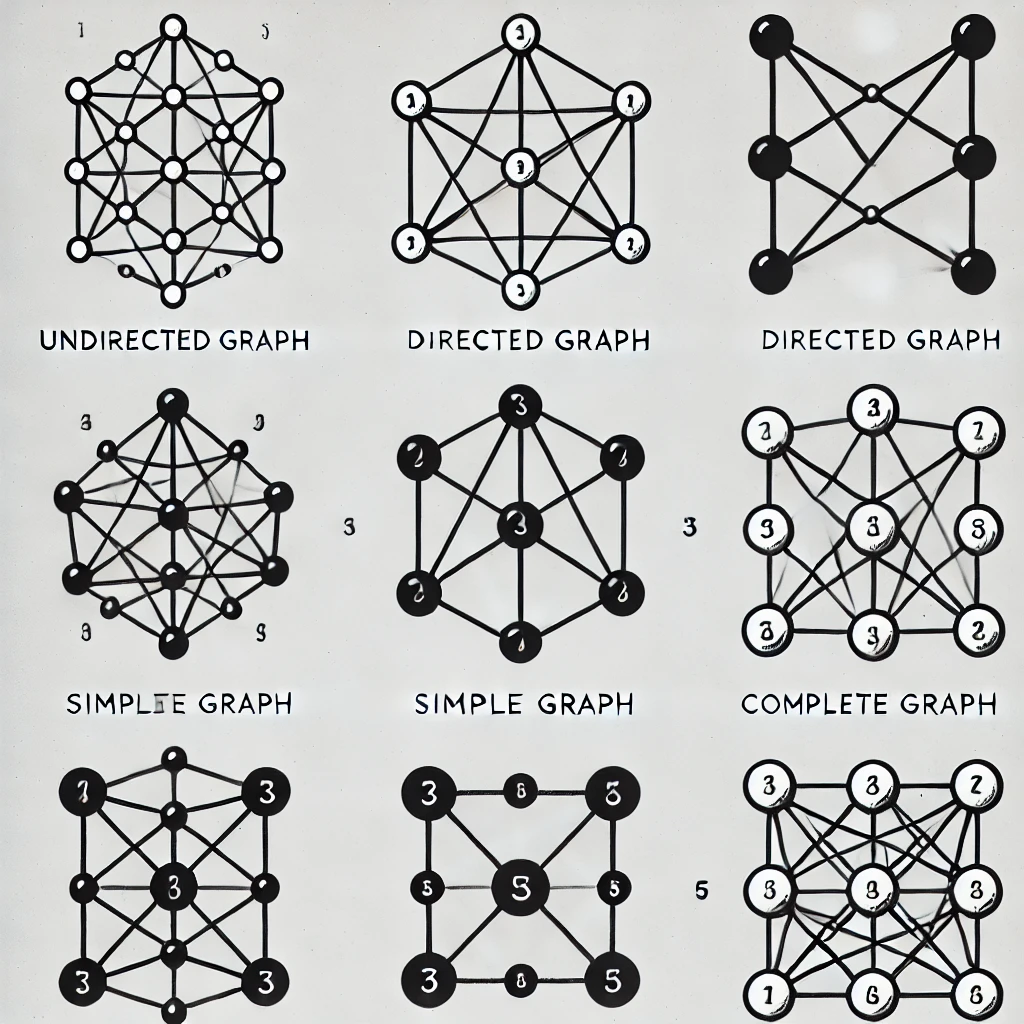
- Graph theory offers powerful tools for representing, analysing, and solving problems that involve properties, structures and relationships between data elements. It focuses on studying graphs, which consist of vertices (or nodes) connected by edges (or links).
- Vertices (Nodes): These are the basic points in a graph. ‘One node is called Vertex whereas Multiple nodes are called Vertices.’
- Edges (Links): These are the lines connecting the points.
1. Properties
Properties describe the characteristics of a graph, such as how the nodes and connections behave:
- Vertices (Nodes): Think of these as points or locations, like cities on a map.
- Edges (Connections): These are the links between the nodes, similar to roads connecting cities.
- Example: Consider three cities: A, B, and C. A is connected to B by a road, and B is connected to C by another road, but A and C aren’t directly connected.
Graph #1: A --- B --- C
Properties of Graph:
- There are 3 vertices (A, B, and C).
- There are 2 edges (A-B and B-C).
Degree of a vertex: The degree refers to the number of connections a node has.
- Degree of A = 1
- Degree of B = 2
- Degree of C = 1
2. Structures
The structure and arrangement of the graph determine its type:
- Undirected Graph: Edges have no direction (e.g., two-way roads). The previous example (Graph #1) is an undirected graph.
- Directed Graph (Digraph): Edges have a direction (e.g., one-way streets). If A → B and B → C, it would look like:
- Graph#2: A → B → C
- Weighted Graph: Edges are assigned values, such as distance or cost. For example, if the distance between A and B is 5 km, and between B and C is 10 km:
Graph #3: A --(5)-- B --(10)-- C
3. Relationships
Relationships between vertices define how they are connected:
- Path: A sequence that shows how to move from one vertex to another.
For example, from A to C, one possible path is: A → B → C. - Cycle: A path that starts and ends at the same vertex.
For instance, if we add an edge from C to A, it forms a cycle: A → B → C → A. - Connectivity: This refers to whether all vertices can be reached from any other vertex.
- A graph is connected if there’s a path between every pair of vertices.
- If we remove vertex B, A and C will no longer be connected.
Real-World Analogy
Let’s think of a school bus network:
- Vertices (Nodes): Represent bus stops.
- Edges (Connections): Represent the roads between the bus stops.
- Weights: Represent distances (e.g., 2 km, 3 km).
Graph Example: Stop 1 -- (2 km) -- Stop 2 -- (3 km) -- Stop 3
- The path from Stop 1 to Stop 3 is 5 km (2 km + 3 km).
- If there’s a direct road between Stop 1 and Stop 3, we can compare the direct route to the combined path to see which is shorter.
Finished reading? Test yourself with 10 questions on this topic.
Go to the questions →From I Am Datapedia! by Mustafa Qizilbash, published here free by the author. Nothing about your reading is stored.