Once you sign in, your details will show here.
Knowledge Hub
+ New Topic
Filter (1)
Sort
62 topics · Data Warehousing and Business Intelligence · 10 shown
Show allEvery topic is free to read. A free account also lets you search the topics, react to a topic and comment under it.
- I Am Datapedia!
Data Modeling and Design
3NF Data Modelling(bill Inmon)
3NF Data Modelling, championed by Bill Inmon, organizes enterprise data in a normalized structure, typically Third Normal Form (3NF), to build a centralized Enterprise Data Warehouse (EDW). The warehouse is subject-oriented, integrated, time-variant, and non-volatile, serving as the authoritative single source of truth for the organization.
The primary goal of a 3NF Data Warehouse is to create a consistent and governed enterprise data foundation. By eliminating redundancy and enforcing referential integrity, the EDW ensures that core entities such as Customer, Loan, Officer, and Product are defined once and integrated across all source systems. This approach prioritizes data quality, traceability, and long-term governance over direct query performance.
In this architecture, data from operational systems is extracted, cleansed, standardized, and loaded into normalized tables. For example, Customer data from a CRM system and Customer data from a Core Banking system are reconciled and integrated under a single enterprise identifier. Loan terms, balances, approval decisions, and officer assignments are stored in separate but related 3NF tables, each with clearly defined primary and foreign keys. Redundancy is minimized, and relationships are explicitly maintained.
4 min readMore
- I Am Datapedia!
Data Modeling and Design
Dimensional Data Modelling
Dimensional Data Modelling is an analytical modelling approach that structures data into facts (quantitative measures) and dimensions (descriptive attributes) to support reporting, dashboards, and business intelligence. It provides a simplified, performance-oriented representation of organizational data, making analytics accessible to both technical and business users.
The primary goal of dimensional modelling is to deliver a business-friendly and performance-optimized structure that enables fast and intuitive access to information. Rather than focusing on eliminating redundancy at all costs, dimensional modelling focuses on making data easy to query, aggregate, and understand.
Dimensional models are organized around business processes. A fact table captures measurable events, such as loan approvals, repayments, or transactions. Surrounding the fact table are dimension tables, which provide context, such as customer attributes, officer details, product types, and dates. Together, they answer two fundamental questions:
3 min readMore
- I Am Datapedia!
Data Warehousing and Business Intelligence
WHAT IS A FACT Table?
A Fact is the central table in dimensional data modelling that stores the measurable outcomes of a business process. These measures are typically numeric and are designed to be aggregated, analysed, and reported across multiple perspectives provided by dimension tables.
The primary goal of a fact table is to capture business events in a structured format that supports performance analysis and decision-making. Facts answer the question: “What happened?” They represent transactions, events, or measurable states that the organization wants to analyse.
A fact table typically contains:
- Numeric measures (e.g., LoanAmount, ApprovalCount, RepaymentAmount)
- Foreign keys to dimension tables (e.g., Customer_ID, Officer_ID, Branch_ID, Time_ID)
- Minimal descriptive attributes of its own
For example, in a loan approval environment, a Fact_LoanApproval table may contain:
- Loan_ID (Primary Key)
- Customer_ID (Foreign Key)
- Officer_ID (Foreign Key)
- Branch_ID (Foreign Key)
- Time_ID (Foreign Key)
- LoanAmount
- InterestRate
- ApprovalFlag
3 min readMore
- I Am Datapedia!
Data Warehousing and Business Intelligence
WHAT IS A DIMENSION Table?
A Dimension is a descriptive table in dimensional modelling that provides context to fact tables. While facts record measurable events, dimensions explain those events by supplying descriptive attributes such as names, categories, locations, and time periods. Dimensions answer questions such as who, what, when, where, and sometimes how.
The primary goal of a dimension is to make numeric measures meaningful and interpretable. Without dimensions, numbers such as LoanAmount or ApprovalCount would lack business relevance. Dimensions provide the language that business users understand.
A dimension table typically contains:
- A primary key (e.g., Customer_ID, Officer_ID, Branch_ID, Time_ID)
- Descriptive attributes (e.g., Name, Segment, Region, ExperienceYears)
- Hierarchies for reporting (e.g., Day → Month → Quarter → Year)
For example, in a loan approval data warehouse:
- Dim_Customer may include CustomerID, Name, AgeGroup, IncomeBand, Segment.
- Dim_Officer may include OfficerID, Name, Branch, ExperienceYears.
- Dim_Branch may include BranchID, City, Region.
- Dim_Date may include DateID, Day, Month, Quarter, Year.
3 min readMore
- I Am Datapedia!
Data Warehousing and Business Intelligence
Star Schema
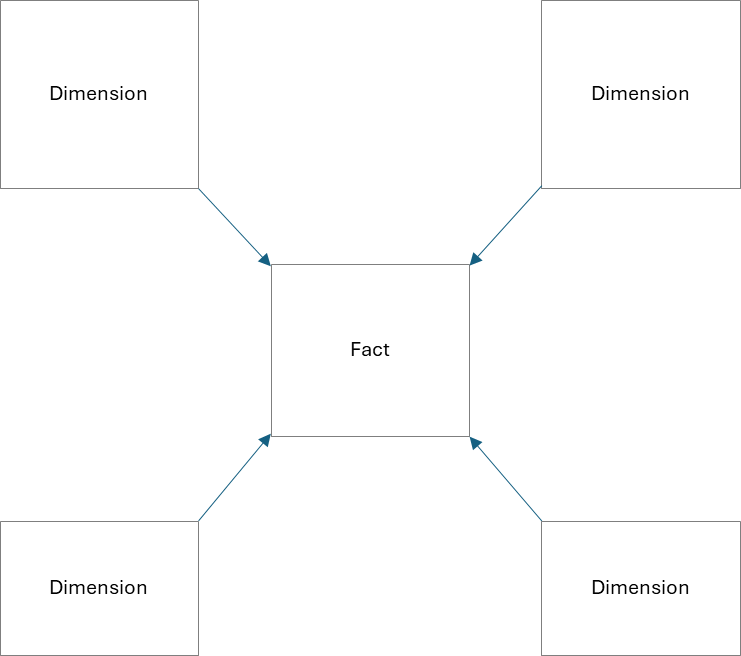
The Star Schema is a dimensional modelling design in which a central fact table connects directly to multiple surrounding dimension tables, forming a star-like structure. The fact table stores quantitative measures of a business process, while the dimension tables provide descriptive context for analysis.
The primary goal of the star schema is to deliver a simple, high-performance, and business-friendly structure for analytics. It is designed specifically for reporting, dashboards, and self-service business intelligence, where clarity and speed are critical.
In a star schema, the fact table captures measurable events such as LoanAmount, InterestRate, ApprovalCount, or RepaymentAmount. Each row represents a clearly defined grain, such as one loan approval or one repayment transaction. The fact table contains foreign keys that link to dimension tables.
The dimension tables contain descriptive attributes used for filtering, grouping, and slicing data. Examples include:
3 min readMore
- I Am Datapedia!
Data Warehousing and Business Intelligence
Snowflake Schema
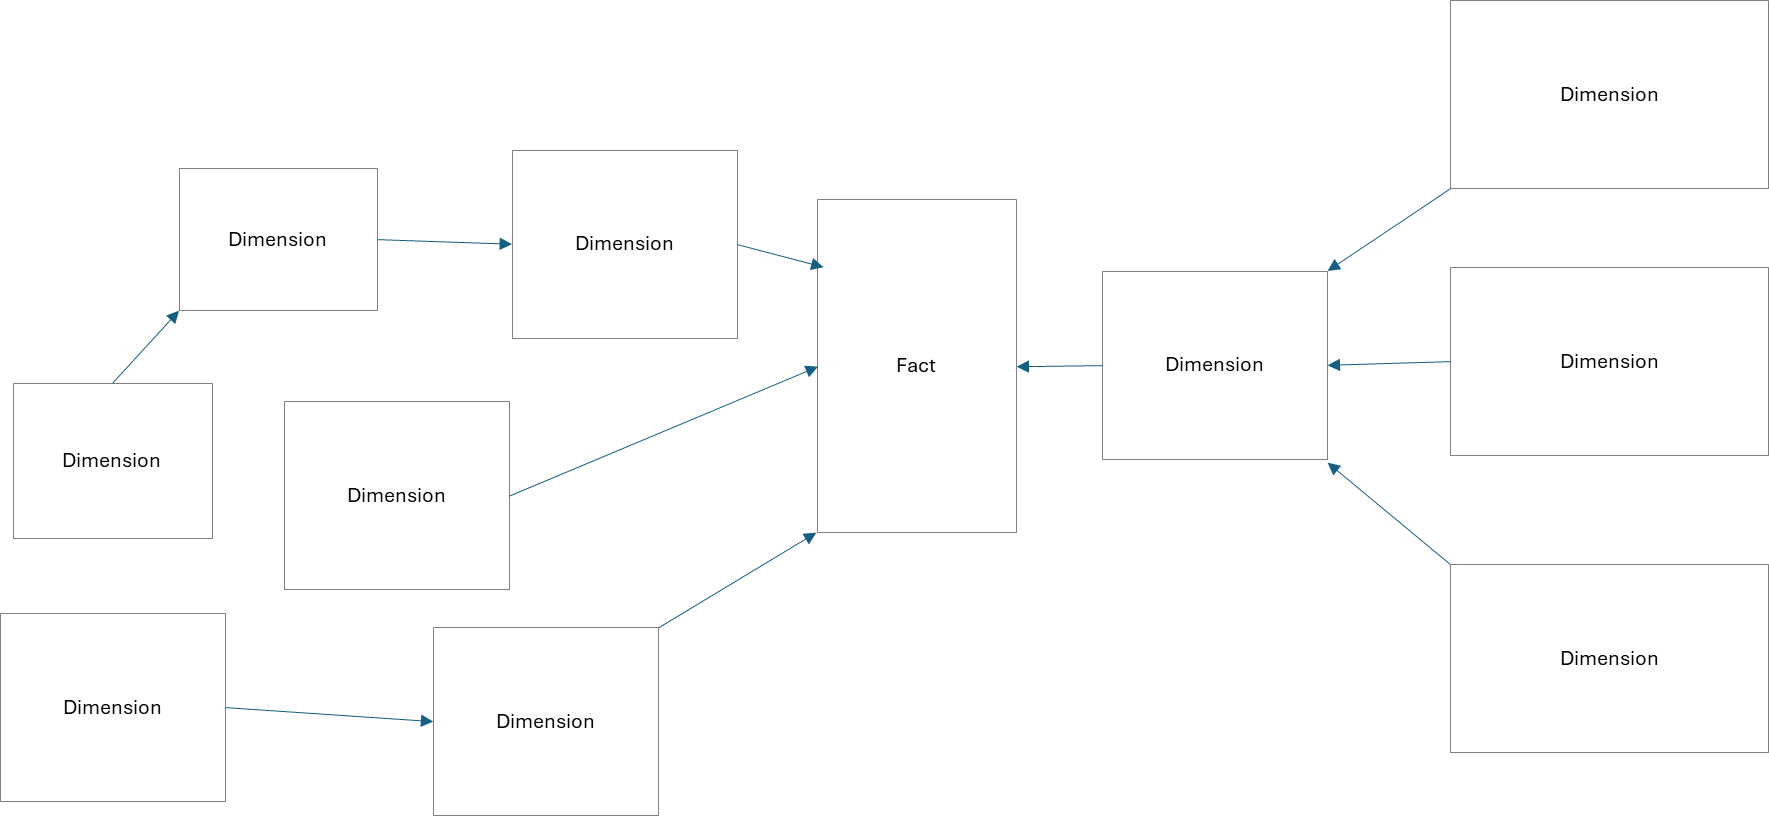
The Snowflake Schema is a dimensional modelling design in which one or more dimension tables are normalized into related sub-dimensions, forming a snowflake-like structure around a central fact table. While the fact table remains the analytical core, dimension tables are decomposed to reduce redundancy and improve governance.
The primary goal of the snowflake schema is to improve data quality, storage efficiency, and reusability, especially for large, shared dimensions, while still preserving dimensional modelling semantics for analytics.
A snowflake schema typically begins as a classic star schema (Fact + Dimensions). Over time, wide dimension tables may be normalized into smaller, related sub-dimensions. For example:
- Dim_Customer may be split into:
- Customer (core identity attributes)
- Demographics (age band, income band)
- Employment (industry, employer category)
- Geography (city, region, country)
3 min readMore
- Dim_Customer may be split into:
- I Am Datapedia!
Data Modeling and Design
Data Vault MOdelling
Data Vault Data Modelling belongs to the family of Ensemble Data Modelling.
In discussions about modern data warehousing, terms like Data Vault (DV), Business Vault (BV), Raw Vault, and Information Vault are often used, leading to confusion. However, it’s crucial to clarify there is only one Data Vault methodology, designed to streamline and enhance data warehousing. Originating in 2000, Data Vault was developed as a comprehensive, agile warehousing method that effectively manages complex data requirements. What some refer to as “Business Vault” or “Raw Vault” are not distinct systems but extensions within the core Data Vault model, designed to address specific needs within the same foundational framework. This misconception often creates unnecessary complexity; it’s more accurate to simply refer to “Data Vault” as a single, unified approach.
To fully understand Data Vault modelling, it's helpful to first revisit foundational Data Warehouse concepts. Decades ago, Bill Inmon, known as the "Father of Data Warehousing," introduced the Data Warehouse concept, based on third normal form (3NF) data modelling, which emphasizes organizing data by business entities to reduce redundancy and maintain integrity. Ralph Kimball later popularized the dimensional approach, which uses star or snowflake schemas to simplify data for analytical purposes. This article will focus on the Data Vault model, which is a modern, agile alternative that addresses some of the limitations of traditional models.
8 min readMore
- I Am Datapedia!
Data Modeling and Design
Focal Point Data Modelling
Just like Data Vault, Focal Point Data Modelling also belongs to the family of Ensemble Data Modelling.
The modelling process in the Focal methodology is organized into five distinct stages, referred to as the Focal Forms:
- Focal Form One – Identify and define the primary business concept entities.
- Focal Form Two – Identify and define the natural business relationships between the core business concepts.
- Focal Form Three – Identify the attributes of the core business concepts, focusing on capturing terms or attributes that are categorized as descriptive characteristics of the business concepts.
- Focal Form Four – Group the attributes into Descriptor Concepts. This step is unique to Focal, as it emphasizes good definition practices. The task is to categorize attributes into one of 10 predefined Descriptor Concepts, each with a specific definition. For example, one such descriptor concept is Condition, which is a qualifying attribute related to a Focal. A Condition serves two main purposes: (1) it imposes constraints or modifications on the Entity’s characteristics or behaviour, and (2) it specifies requirements that must be met by the Entity. These Conditions are often established through agreements between relevant parties regarding specific Focal members. In practice, Conditions take the form of concrete parameters that influence business relationships or transactions. For instance, in a Contract Focal, the start date acts as a temporal Condition; in a Loan Focal, the interest rate represents a financial Condition; and in an Order Focal, the payment date serves as a temporal Condition that needs to be met.
- Focal Form Five – Atomic Context. Determine which attributes group together at the most granular level, answering a specific atomic question. This step is crucial for physical implementation, as it helps identify attribute sets that consist of a small number (usually no more than five) of related attributes.
7 min readMore
- I Am Datapedia!
Data Modeling and Design
Anchor Data Modelling
Just like Data Vault & Focal Point, Anchor Data Modelling also belongs to the family of Ensemble Data Modelling.
These methodologies aim to design data models that are flexible, scalable, and adaptable to changing business requirements. Anchor Data Modelling focuses on simplifying the Modelling process, improving data governance, and ensuring data consistency while supporting agile data integration and analytics.
The modelling process in the Anchor methodology is organized into below list of elements from which main are Anchor, Knot and Attribute.
The main elements of Anchor Data Modelling, as you mentioned, include Anchor, Knot, Attribute, and Tie. Below is an elaborate explanation of each of these elements:
1. Anchor
The Anchor is the fundamental building block of Anchor Data Modelling. It represents a core entity or concept that exists over time and is independent of other attributes. Anchors are stable and persistent throughout their lifecycle.
6 min readMore
- I Am Datapedia!
Data Warehousing and Business Intelligence
Unified Star Schema (Uss)
The Unified Star Schema (USS) is an advanced dimensional modelling approach that enhances traditional star schemas by introducing a central structure known as the Puppini Bridge. This bridge aligns facts and dimensions into a single, consistent analytical framework, making queries more reliable, intuitive, and resistant to common join errors.
The primary goal of USS is to provide a unified query entry point that eliminates ambiguity when working with multiple fact tables. It simplifies drill-across analysis and ensures business users receive consistent results without needing deep SQL expertise.
In a traditional dimensional warehouse, each business process, such as Loan Approvals, Repayments, or Customer Interactions, typically has its own fact table. While dimensions may be conformed across these stars, combining multiple fact tables in a single query can lead to common modelling pitfalls:
3 min readMore
Build a strong foundation in Data & AI
Follow the Data Foundations learning path (Beginner to Advanced).