Once you sign in, your details will show here.
Knowledge Hub
+ New Topic
Filter (2)
Sort
49 topics · Data Modeling and Design · Intermediate · 9 shown
Show allEvery topic is free to read. A free account also lets you search the topics, react to a topic and comment under it.
- I Am Datapedia!
Data Warehousing and Business Intelligence
Galaxy Schema
As discussed in topic i.e., Data Warehouse or Data Mart that Star schema and Snowflake Schema both refer to Ralph Kimball Data Warehousing approach. But what about Galaxy Schema?
You must be wondering that we have been hearing about Facts and Dimensions in both Star and Snowflake schema(s) but where are Conformed Dimensions, so here it is.
Galaxy Schema is also known as Fact Constellation Schema and is more complex than Star and Snowflake schema. It’s further divide Star Schema into small Star Schema(s) where there are more than one Fact Table and have Reusable Dimension to connect multiple Fact Tables.
These dimensions which can connect with multiple Fact tables across multiple Star Schema(s) are known as Conformed Dimensions.
1 min readMore
- I Am Datapedia!
Data Warehousing and Business Intelligence
Slowly ChangingDimensions (SCD)
Slowly Changing Dimensions is also known as SCD and is used in Data Warehouse concept. Folks in Data World are very much aware of this term.
Before we understand SCD, one must understand Fact and Dimensions. In dimensional Data Warehouse or in a Data Mart (explained in separate topic), there are two types of schema(s) i.e., Star and Snowflake Schema(s). Both are build based on Facts and Dimensions.
- Facts: This table keeps the transaction’s lowest level of data which can be numeric or non-numeric like sales numbers, number of clicks on social media portal, number of searches in google etc. It’s mainly loaded in append mode, means rows always get inserted. This table is a very fast-moving table, and rows keep coming in. There are hardly any organizations which update and delete data from Fact Tables.
- Dimension: This table on the other hand keeps data element by which Fact can be analyzed e.g., sale by time, sales by region, sales by the product etc. So, Time, Regions, Products etc., are dimensions. In contrast with Fact table, frequency of rows coming in these tables are very low. For Example, once we have loaded regions then when often regions will change 😊. Once Time is loaded, it will never change. At the same time, Products definitions can change. A company today has 100 products, in future it can have more. Then attributes of one product can change in future a well, so there are three ways to keep the history of changed in Dimensions which are handled by principles managed by SLOWLY CHANGING DIMENSIONS (SCD).
2 min readMore
- I Am Datapedia!
Data Modeling and Design
Information Modelling
Information Modelling is not a new term, but nerd data folks hardly get in touch with it as it’s one level above of creating any special solution.
Let’s decode it…..
We also know when we start a project or solution, we begin with Conceptual Model then Logical Model then Physical Model etc. Unlike these models where we focus especially on either entities or relationships or process or constraints, Information Modelling represents entities, relationships, and processes within a system or organization.
Information modelling is a crucial aspect of designing data solutions that goes beyond merely structuring databases. It involves creating a comprehensive representation of how information is organized, flows, and is utilized within an organization or system. Information models provide a framework for understanding the relationships and dependencies among different elements of information, facilitating effective communication and management.
2 min readMore
- I Am Datapedia!
Data Modeling and Design
Supertype and Subtype
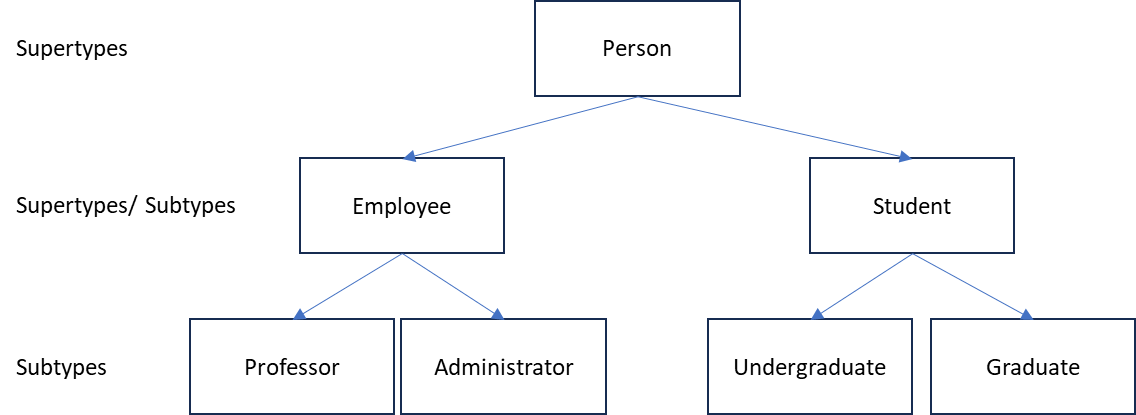
In data modelling, particularly in the context of relational databases, the terms "supertype" and "subtype" are used to describe the relationships between entities.
Let's explore these concepts:
Supertype: A supertype is a generalization that represents a higher-level entity. It encompasses common characteristics shared by multiple lower-level entities.
- It contains attributes common to multiple related entities.
- It represents the generalization of several entities.
- For example, consider a supertype "Vehicle" that includes common attributes like "Manufacturer," "Model," and "Year." Cars, motorcycles, and trucks could be subtypes of this supertype, inheriting these common attributes.
- Subtype: A subtype is a specialization of a supertype, representing a more specific entity with additional attributes or characteristics.
- It inherits attributes from the supertype and may have additional attributes.
- It represents a more specific category within the generalization.
- For example, using the "Vehicle" example, "Car" is a subtype that inherits attributes from the "Vehicle" supertype but may have additional attributes specific to cars, such as "Number of Doors" or "Body Type."
2 min readMore
- I Am Datapedia!
Data Warehousing and Business Intelligence
Attribution Data Models
Over the years, our approach to measuring marketing performance has drastically evolved and continues to change with advancing technology and evolving data policies. The days of rigidly assigning budgets to different marketing channels and relying solely on P&L statements to gauge the success of our efforts are behind us.
Assessing the performance of our ads involves understanding the correlation between our marketing spend and revenue generated. With data sources and clear models, especially when running campaigns across various channels simultaneously (e.g., Facebook, Google, Out Of Home, TV), the key question remains:
Which channels and touchpoints contribute significantly to the final sale?
To evaluate that, we employ distinct data models in marketing, each carrying its own set of advantages and limitations. These models must be tailored to fit each use case and align with how people interact with our business:
4 min readMore
- I Am Datapedia!
Data Foundations
Graph Theory
Graph theory is a mathematical framework that is widely applied to solve real-world problems involving interconnected data. It’s used in various fields such as:
- Computer Science: For tasks like network analysis, designing routing algorithms, indexing databases, and building AI models.
- Social Networks: To analyse relationships and influence across social media platforms.
- Biology: For mapping genetic networks and studying protein interactions.
- Transportation: To improve route planning and manage traffic flow efficiently.
- Project Management: To visualize tasks, dependencies, and project schedules.
- Graph theory offers powerful tools for representing, analysing, and solving problems that involve properties, structures and relationships between data elements. It focuses on studying graphs, which consist of vertices (or nodes) connected by edges (or links).
- Vertices (Nodes): These are the basic points in a graph. ‘One node is called Vertex whereas Multiple nodes are called Vertices.’
- Edges (Links): These are the lines connecting the points.
3 min readMore
- I Am Datapedia!
Data Modeling and Design
Data Modellingwith Graph Theory
Graph Theory offers an effective way to structure data as a graph, allowing efficient representation, querying, and analysis of relationships between data entities. This approach is particularly useful when relationships between data points are as important as the data itself. Here’s a guide to using Graph Theory for data modelling:
Why Use Graph Theory for Data Modelling?
- Natural Representation of Relationships: Graphs naturally represent relationships as edges between nodes. This is especially useful in situations like social networks, knowledge graphs, or hierarchical structures, where the connections are just as significant as the entities themselves.
- Flexibility: Graphs can handle evolving schemas and accommodate unstructured or semi-structured data. New nodes, edges, or properties can be added without needing to restructure the entire system.
- Efficiency in Traversal: Queries on connected data are faster with graph traversal algorithms compared to traditional relational databases. This is helpful for tasks like finding the shortest path, making recommendations, or identifying communities.
4 min readMore
- I Am Datapedia!
Data Modeling and Design
Knowledge Graph (KG)
Just like Row is the physical content in a Relational Database, Knowledge Graph (KG) is the physical content in a Graph Database.
Knowledge Graph (KG) integrates closely with Graph Theory, MetaGraph, Taxonomies, and Ontologies, acting as a unifying framework that bridges these concepts.
Let’s decode…..
A Knowledge Graph is a structured representation of knowledge, where entities (nodes) and their relationships (edges) are stored and queried in a graph format.
In a relational database, the schema (tables, columns, constraints) is empty until you populate it with rows (data). Similarly, the Knowledge Graph is the populated version of Graph Theory (structure), MetaGraph (metadata), Taxonomies (classification), and Ontologies (rules).
In Relational Database, Table Orders with columns OrderID, CustomerID, OrderDate having Rows with actual order records.
In Knowledge Graph, Nodes represent Customers and Orders; edges represent Purchases in this way i.e., (Customer: Alice) -[:Purchases {Date: '2023-12-12'}]-> (Order: #12345)
2 min readMore
- I Am Datapedia!
Data Modeling and Design
Difference BetweenMetaGraph,Ontology andTaxonomy
In simple words, Graph Theory defines the structure i.e., data model, MetaGraph are the metadata, Taxonomies are the classifications, and Ontologies are the rules.
MetaGraph, Taxonomies, and Ontologies are essential tools in knowledge management, data governance, and AI, each serving distinct yet occasionally overlapping purposes. Below is a detailed breakdown of their characteristics and applications.
MetaGraph
MetaGraph represents metadata within a graph database or knowledge graph, providing a high-level overview of the data's structure, relationships, and properties.
Key Characteristics:
- Focus: Outlines the data model, specifying entities (nodes), relationships (edges), and their attributes.
- Structure: Functions like a schema, defining node and edge types, along with constraints.
Purpose:
- Aids in understanding the graph's structure.
- Supports data governance, lineage tracking, and semantic clarity.
- Enables enhanced searchability and automation by contextualizing graph content.
4 min readMore
Build a strong foundation in Data & AI
Follow the Data Foundations learning path (Beginner to Advanced).