Once you sign in, your details will show here.
Knowledge Hub
+ New Topic
Filter (2)
Sort
18 topics · Data Warehousing and Business Intelligence · Beginner · 10 shown
Show allEvery topic is free to read. A free account also lets you search the topics, react to a topic and comment under it.
- I Am Datapedia!
Data Warehousing and Business Intelligence
WHAT IS A FACT Table?
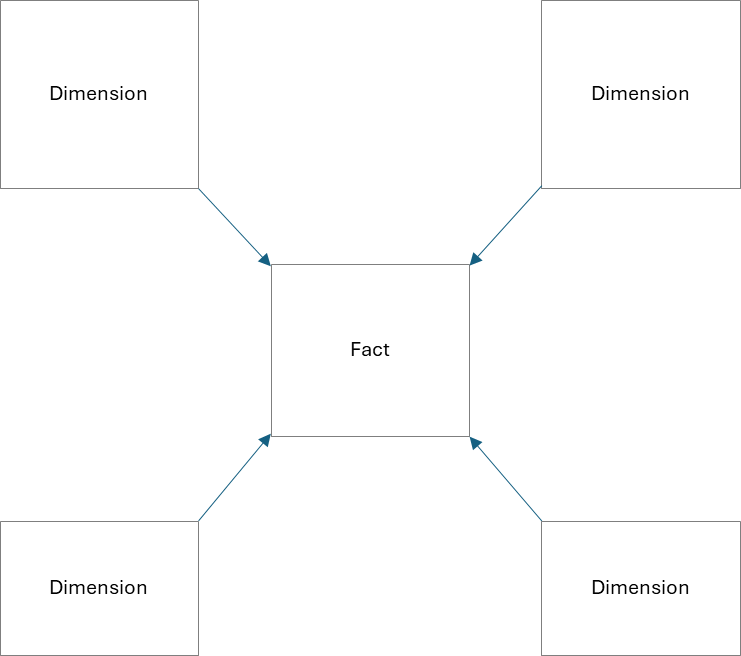
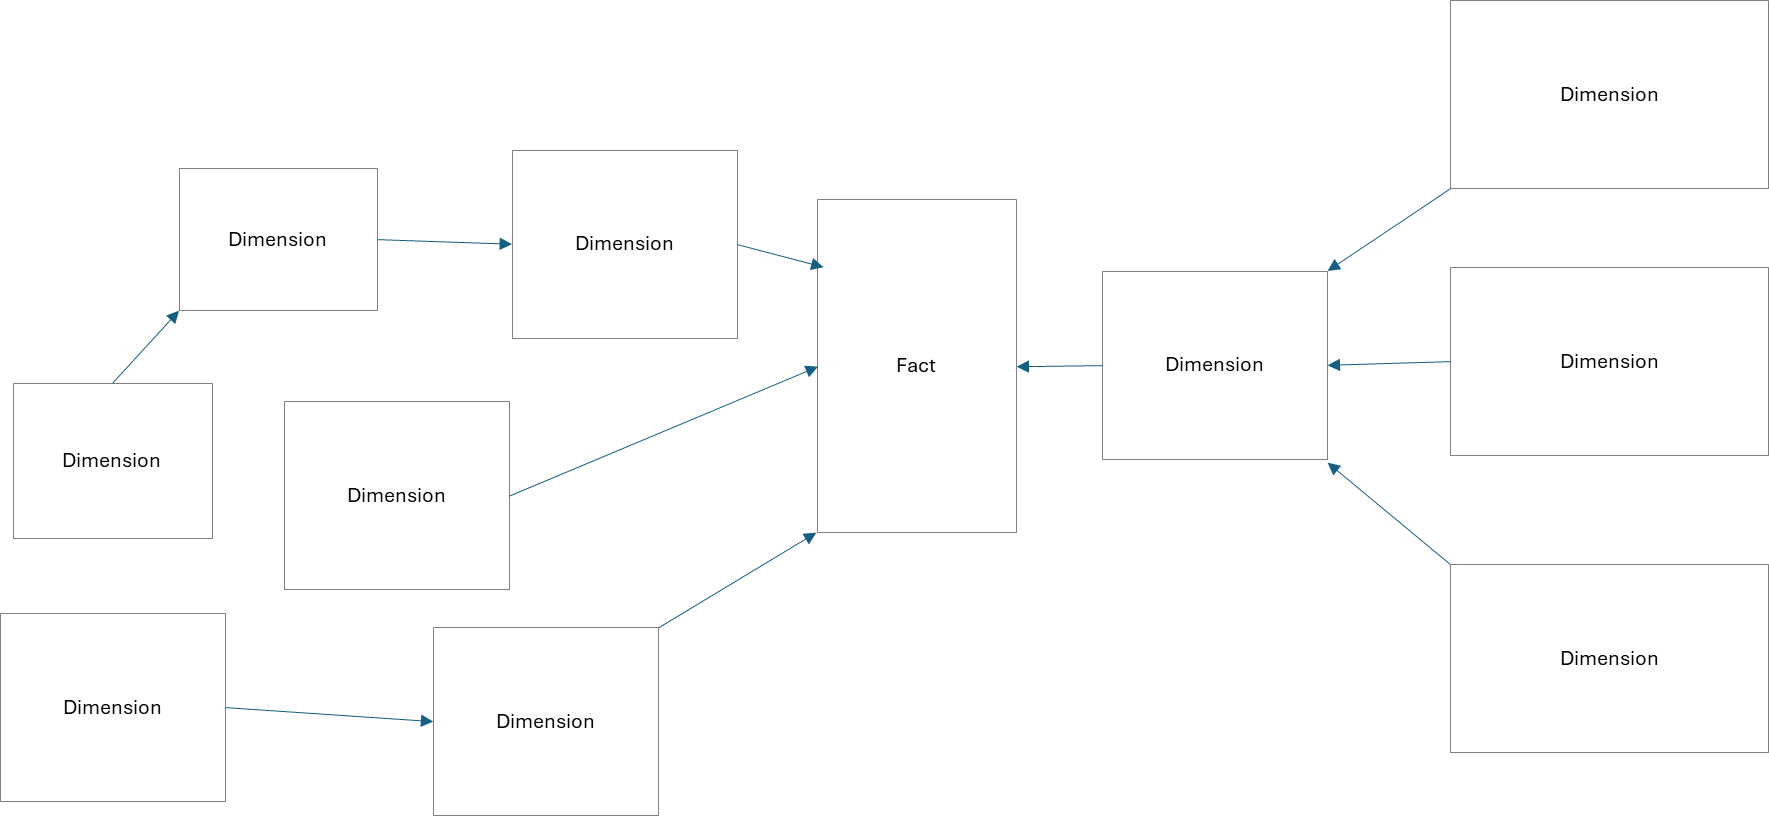
A Fact is the central table in dimensional data modelling that stores the measurable outcomes of a business process. These measures are typically numeric and are designed to be aggregated, analysed, and reported across multiple perspectives provided by dimension tables.
The primary goal of a fact table is to capture business events in a structured format that supports performance analysis and decision-making. Facts answer the question: “What happened?” They represent transactions, events, or measurable states that the organization wants to analyse.
A fact table typically contains:
- Numeric measures (e.g., LoanAmount, ApprovalCount, RepaymentAmount)
- Foreign keys to dimension tables (e.g., Customer_ID, Officer_ID, Branch_ID, Time_ID)
- Minimal descriptive attributes of its own
For example, in a loan approval environment, a Fact_LoanApproval table may contain:
- Loan_ID (Primary Key)
- Customer_ID (Foreign Key)
- Officer_ID (Foreign Key)
- Branch_ID (Foreign Key)
- Time_ID (Foreign Key)
- LoanAmount
- InterestRate
- ApprovalFlag
3 min readMore
- I Am Datapedia!
Data Warehousing and Business Intelligence
WHAT IS A DIMENSION Table?
A Dimension is a descriptive table in dimensional modelling that provides context to fact tables. While facts record measurable events, dimensions explain those events by supplying descriptive attributes such as names, categories, locations, and time periods. Dimensions answer questions such as who, what, when, where, and sometimes how.
The primary goal of a dimension is to make numeric measures meaningful and interpretable. Without dimensions, numbers such as LoanAmount or ApprovalCount would lack business relevance. Dimensions provide the language that business users understand.
A dimension table typically contains:
- A primary key (e.g., Customer_ID, Officer_ID, Branch_ID, Time_ID)
- Descriptive attributes (e.g., Name, Segment, Region, ExperienceYears)
- Hierarchies for reporting (e.g., Day → Month → Quarter → Year)
For example, in a loan approval data warehouse:
- Dim_Customer may include CustomerID, Name, AgeGroup, IncomeBand, Segment.
- Dim_Officer may include OfficerID, Name, Branch, ExperienceYears.
- Dim_Branch may include BranchID, City, Region.
- Dim_Date may include DateID, Day, Month, Quarter, Year.
3 min readMore
- I Am Datapedia!
Data Warehousing and Business Intelligence
Data Segmentation
‘Data Segmentation is about dividing dataset into multiple sections based on some requirements.’
Segments are defined based on many parameters e.g., in a business, segments are defined by accessibility, actionable, profitable etc.
For example, when we go into a mall, there is a segment/section for Food Court where multiple categories of food are available with different classification like expensive or cheap food.
Steps to improve Data Segmentation
- Enrich your data to increase data quality.
- Plan and replan your data segmentation criteria(s)
- Improve real time segmentation.
- Design segment based on customer prioritization and feedback.
- Integrate with as many data elements.
In business, what you can do by having Data Segmentation
- You can create deals based on customer buying behavior.
- You can improve your products arrangement.
- You can plan your marketing strategy.
- You can analyze customer feedback.
1 min readMore
- I Am Datapedia!
Data Warehousing and Business Intelligence
Data Warehouse and Data Marts
The idea of a Data Warehouse emerged when organizations realized that transactional systems (OLTP), while excellent for recording day-to-day operations, were never designed for heavy reporting or analytical workloads. As business leaders demanded consolidated views of performance, finance, sales, and customer behaviour, data modelers introduced the concept of a centralized analytical datastore, the Data Warehouse, to relieve OLTP systems from the burden of reporting and to provide trusted, historical insight.
It is important to clarify a common source of confusion: a Data Warehouse is not the same as Dimensional Modelling. The warehouse refers to the central repository that consolidates data from multiple source systems, while dimensional modelling is only one possible technique for structuring that repository. A Data Warehouse can be designed in different ways, depending on organizational priorities such as performance, scalability, or agility.
5 min readMore
- I Am Datapedia!
AI and Machine Learning
Data Science vsData Mining
These are one of the most confusing terms in the data domain. Both are mostly confused with each other.
The major difference between both is.
- Data Mining is done on ONLY structured data.
- Data Science is done on structured, semi and unstructured data.
Data Science is mostly tagged with Big Data and Data Mining is tagged with Data Warehousing. There are many definitions and comparisons for both in the market as both do machine learning, deep learning, data cleansing, statics, and math algorithms etc.
‘Data Science is the Superset of Data Mining.’
Data Mining is also known as KDD (Knowledge Discovery in Data). First it was performed in excel, then with the introduction of DWH, an automated process started discovering historical patterns and other valuable information from large data sets which are structured.
Now with the introduction of Big Data, Data Lake, NoSQL databases, semi and unstructured datasets, the magnitude of the data size has taken a huge step ahead and Data Science has come onto the surface.
2 min readMore
- I Am Datapedia!
Data Governance
Data Democratization
We all have heard about the Data Driven Organization concept, so here is how it’s done. Data Democratization will make it happen.
‘Data Democratization is the foundation for Data Self-Service Environment.’
Data Democratization/ Data Self-Service is not a tool, nor it’s a technology. It’s about the working behavior of everyone within an organization with respect to data. Traditionally, whenever we need data, we go to IT and ask for some reports or dashboards. We normally tell them, this is our KPI, in other words, we tell them in simple English e.g., we need sales reports about a product from a particular region. Now, it’s IT’s job to find out where relevant data is residing, it’s their job to extract, process and prepare data for business users in the shape of a report or a dashboard. The worrying part is e.g., after IT takes 3 months to prepare a dashboard for Business User and when user says, please include 1 more column 😊, now the whole exercise starts from scratch. Data Democratization fills this gap.
2 min readMore
- I Am Datapedia!
Data Governance
Data Literacy
Data Literacy is the key for all Data Initiatives.
We know the difference between Business Intelligence (BI) developers and Business Analysts (BA). In previous eras, BA used to talk to business, create KPI(s) and pass it to BI developers to create reports and dashboards. 90% of BI developers would not know what a report or a dashboard is for. They won’t know the impact of good and bad reports. They won’t know the ROI of information this report, or dashboard can produce due to which they don’t care whether BA has provided right KPI(s) or not. This era was not a Data Era, in that era Reports or Dashboards were good to have. Most of the decision making used to happen in reports extracted in excels 😊.
Now time has changed, we have entered the Analytics era as compared to previous era of Analysis. Difference between Analysis and Analytics is simple but tricky i.e., Analysis is about finding Whys’ and What’s whereas Analytics is about finding How’s from a dataset. In other words, in datasets, Analysis search Questions and Analytics propose Answers.
2 min readMore
- I Am Datapedia!
Data Warehousing and Business Intelligence
Business Intelligence andBusiness Analytics
Business Intelligence and Business Analytics both look the same but have different standing in terms of Decision Making.
Business Intelligence has been there for decades with respect to tools and technologies. Business Analytics has also been there but mostly tagged with manual effort by Functional, Business or Financial Consultants.
Howard Dresner coined the modern definition of the term “business intelligence” in 1989, at least in the sense it is typically used in industry today (“end-user access to and analysis of structured content, i.e., data”).
As there weren't a lot of tools available in the market for Analytics, so many companies were making fortunes for this piece of manual effort. Now the question comes, when Business Intelligence tools were there, how come Business Analytics was manual and why Intelligence and Analytics cannot be done using the same tools? For this, one must first understand the differences in how Intelligence and Analytics processing works.
2 min readMore
- I Am Datapedia!
Data Warehousing and Business Intelligence
Data Visualization
We have covered Business Intelligence, Business Analytics, Data Modelling and Data Cardinality, it's the right time to discuss Data Visualization.
Data Visualization is what is seen by End Users. The Success or Failure of the project is determined based on it. As the phrase goes, 'If you can't draw it, you don't Know it.' And it’s very true. One can spend millions of dollars, can implement a perfect Data Strategy, can have perfect EDW or Data Lake etc. etc. but after all the hard work if the End User can't see what is implementation, if the End User is unable to make use of the data for DSS, if End User will have to go back to their Finance or Technical departments for manual data extraction then all the efforts put-in is nothing more than Waste of Time and Dollars.
Now, there are rules to have good Data Visualization which is relevant to any visualization tools in the market like Tableau, Qlik, Power BI, OBIEE, Cognos and many more.
3 min readMore
- I Am Datapedia!
Data Warehousing and Business Intelligence
Heat Map
Heat Map is a graphical representation of objects at any specific location. Nowadays, it is used to identify highly populated area(s) during Covid-19 era. Heat maps make it easy to visualize complex data and understand it briefly.
Now, the question is how Heat Map software knows where the location is. When we open any webpage or any app like Facebook or Twitter etc., via mobile or laptop, our location is picked up. That location is based on Lat and Long (Latitude and Longitude) values. These values are then sent to databases which are then picked up by the Heat Map software for graphical presentation.
- Latitude is the measurement of distance north or south of the Equator. It is measured with 180 imaginary lines that form circles around the Earth east-west, parallel to the Equator.
- Longitude is the measurement east or west of the prime meridian. Longitude is measured by imaginary lines that run around the Earth vertically (up and down) and meet at the North and South Poles. These lines are known as meridians. Each meridian measures one arc degree of longitude. The distance around the Earth measures 360 degrees.
2 min readMore
Build a strong foundation in Data & AI
Follow the Data Foundations learning path (Beginner to Advanced).