Once you sign in, your details will show here.
Knowledge Hub
+ New Topic
Filter (1)
Sort
87 topics · Data Modeling and Design · 10 shown
Show allEvery topic is free to read. A free account also lets you search the topics, react to a topic and comment under it.
- I Am Datapedia!
Data Warehousing and Business Intelligence
Star Schema
As discussed in the topic i.e., Data Warehouse or Data Mart, Star schema and Snowflake Schema both refer to Ralph Kimball Data Warehousing approach.
As per Ralph Kimball, we MUST use Dimensional Modelling for Data Warehousing and Data Marts consisting of Star and Snowflake Schemas.
In Star Schema, the model has a Fact table in the middle and all the Dimensions are joined with the Fact. For example, there is a Fact table called Sales and there can be many dimensions like Time, Location, Product, Categories etc. The Primary Key of the Fact table consists of all the foreign key columns coming from Dimensions. This way when a report or a query is created, there is always one direct join with any Dimension.
1 min readMore
- I Am Datapedia!
Data Warehousing and Business Intelligence
Snowflake Schema
As discussed in topic i.e., Data Warehouse or Data Mart that Star schema and Snowflake Schema both refer to Ralph Kimball Data Warehousing approach.
As per Ralph Kimball, we MUST use Dimensional Modelling for Data Warehousing and Data Marts consisting of Star and Snowflake Schemas.
In Snowflake Schema, the model also has a Fact table in the middle and Dimensions around it but here Dimensions can be normalized further in multiple Sub-dimensions which changes the query to create a report where there will be multiple joins to reach a conclusive result. For example, there is a Fact table called Sales and a Dimension i.e., Location, this location Dimension can be normalized further in State, City, and Postal Code etc.
1 min readMore
- I Am Datapedia!
Data Warehousing and Business Intelligence
Galaxy Schema
As discussed in topic i.e., Data Warehouse or Data Mart that Star schema and Snowflake Schema both refer to Ralph Kimball Data Warehousing approach. But what about Galaxy Schema?
You must be wondering that we have been hearing about Facts and Dimensions in both Star and Snowflake schema(s) but where are Conformed Dimensions, so here it is.
Galaxy Schema is also known as Fact Constellation Schema and is more complex than Star and Snowflake schema. It’s further divide Star Schema into small Star Schema(s) where there are more than one Fact Table and have Reusable Dimension to connect multiple Fact Tables.
These dimensions which can connect with multiple Fact tables across multiple Star Schema(s) are known as Conformed Dimensions.
1 min readMore
- I Am Datapedia!
Data Warehousing and Business Intelligence
Slowly ChangingDimensions (SCD)
Slowly Changing Dimensions is also known as SCD and is used in Data Warehouse concept. Folks in Data World are very much aware of this term.
Before we understand SCD, one must understand Fact and Dimensions. In dimensional Data Warehouse or in a Data Mart (explained in separate topic), there are two types of schema(s) i.e., Star and Snowflake Schema(s). Both are build based on Facts and Dimensions.
- Facts: This table keeps the transaction’s lowest level of data which can be numeric or non-numeric like sales numbers, number of clicks on social media portal, number of searches in google etc. It’s mainly loaded in append mode, means rows always get inserted. This table is a very fast-moving table, and rows keep coming in. There are hardly any organizations which update and delete data from Fact Tables.
- Dimension: This table on the other hand keeps data element by which Fact can be analyzed e.g., sale by time, sales by region, sales by the product etc. So, Time, Regions, Products etc., are dimensions. In contrast with Fact table, frequency of rows coming in these tables are very low. For Example, once we have loaded regions then when often regions will change 😊. Once Time is loaded, it will never change. At the same time, Products definitions can change. A company today has 100 products, in future it can have more. Then attributes of one product can change in future a well, so there are three ways to keep the history of changed in Dimensions which are handled by principles managed by SLOWLY CHANGING DIMENSIONS (SCD).
2 min readMore
- I Am Datapedia!
Data Modeling and Design
Information Modelling
Information Modelling is not a new term, but nerd data folks hardly get in touch with it as it’s one level above of creating any special solution.
Let’s decode it…..
We also know when we start a project or solution, we begin with Conceptual Model then Logical Model then Physical Model etc. Unlike these models where we focus especially on either entities or relationships or process or constraints, Information Modelling represents entities, relationships, and processes within a system or organization.
Information modelling is a crucial aspect of designing data solutions that goes beyond merely structuring databases. It involves creating a comprehensive representation of how information is organized, flows, and is utilized within an organization or system. Information models provide a framework for understanding the relationships and dependencies among different elements of information, facilitating effective communication and management.
2 min readMore
- I Am Datapedia!
Data Modeling and Design
Supertype and Subtype
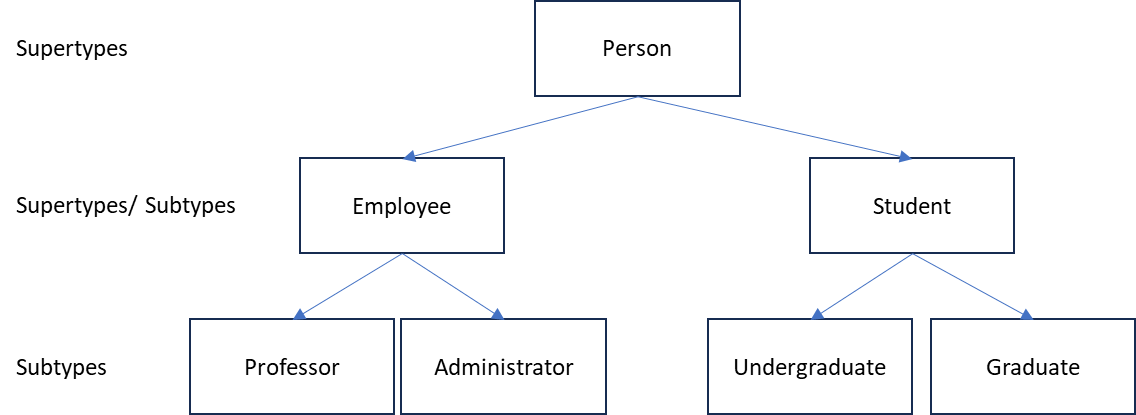
In data modelling, particularly in the context of relational databases, the terms "supertype" and "subtype" are used to describe the relationships between entities.
Let's explore these concepts:
Supertype: A supertype is a generalization that represents a higher-level entity. It encompasses common characteristics shared by multiple lower-level entities.
- It contains attributes common to multiple related entities.
- It represents the generalization of several entities.
- For example, consider a supertype "Vehicle" that includes common attributes like "Manufacturer," "Model," and "Year." Cars, motorcycles, and trucks could be subtypes of this supertype, inheriting these common attributes.
- Subtype: A subtype is a specialization of a supertype, representing a more specific entity with additional attributes or characteristics.
- It inherits attributes from the supertype and may have additional attributes.
- It represents a more specific category within the generalization.
- For example, using the "Vehicle" example, "Car" is a subtype that inherits attributes from the "Vehicle" supertype but may have additional attributes specific to cars, such as "Number of Doors" or "Body Type."
2 min readMore
- I Am Datapedia!
Data Storage and Operations
Views
Views are fundamental in the world of data, serving as a foundational concept. Although it may seem basic, understanding views is crucial as we will delve into more advanced topics such as Materialized Views and External Tables.
Let's break it down...
In the realm of databases, we are familiar with tables, structured with columns and rows, each representing a specific dataset post-normalization (a topic we'll cover separately). Examples include tables for employees, departments, and salaries.
Now, imagine the need to combine information from these tables, like obtaining a comprehensive view of a customer's department and salary. To achieve this, we would typically construct a query that involves joining these tables, providing us with a consolidated result.
However, if we find ourselves running this query frequently, perhaps on a daily or monthly basis, creating a "view" becomes advantageous. A view allows us to encapsulate the query and, when needed, execute a simple SELECT command on the view to retrieve the combined results from the employee, department, and salary tables.
2 min readMore
- I Am Datapedia!
Data Warehousing and Business Intelligence
Attribution Data Models
Over the years, our approach to measuring marketing performance has drastically evolved and continues to change with advancing technology and evolving data policies. The days of rigidly assigning budgets to different marketing channels and relying solely on P&L statements to gauge the success of our efforts are behind us.
Assessing the performance of our ads involves understanding the correlation between our marketing spend and revenue generated. With data sources and clear models, especially when running campaigns across various channels simultaneously (e.g., Facebook, Google, Out Of Home, TV), the key question remains:
Which channels and touchpoints contribute significantly to the final sale?
To evaluate that, we employ distinct data models in marketing, each carrying its own set of advantages and limitations. These models must be tailored to fit each use case and align with how people interact with our business:
4 min readMore
- I Am Datapedia!
Data Integration and Interoperability
Ontology-DrivenData Integration andHarmonization
The role of ontology in data integration and harmonization is to describe structure and relations. Ontologies enable a coherent structure for data across systems, functions, and domains. As the cost of maintaining and point-to-point integrations is growing along with the cost for running specific data pipelines there is a need for a new approach. By having an ontological approach to an organization’s data-driven strategy cost control will be easier to achieve.
The Concept of Ontology in Data Management
Ontologies in data management involve the use of a shared vocabulary and a set of relationships and rules to model a domain. They provide a common language for data and thus enable different systems and stakeholders to 'speak' the same language.
Data Integration Challenges
- Disparate Data Sources: Organizations often deal with data from various sources each with their unique format and structure.
- Semantic Discrepancies: Different interpretations of data across systems can lead to inconsistencies and misunderstandings.
2 min readMore
- I Am Datapedia!
Data Modeling and Design
The Operational Reference Model:Implementing Dynamic Information Models
To succeed with metadata management, you will need an Operational Reference Model. It is the way to describe the structures and relationships of your business metadata.
The Role and relationship of an Operational Reference Model
Conceptual models, logical models, physical models and canonical models have a specific purpose which is either communication and understanding, or representation of an individual system. Operational Reference Models come into play when organizations require an operational layer which bridges multiple systems and functions and provides a common point of reference or shared language for the enterprise. The Operational Reference Model is similar. to an anti-corruption layer and a semantic layer in its purpose but with an important difference, it's owned and governed by your subject matter experts.
Operational reference model governance
An operational reference model is at its core a set of metadata structured with the help of taxonomies and ontologies. Each part, each domain, is governed by the subject matter experts in the organization in accordance with a federated governance approach.
3 min readMore
Build a strong foundation in Data & AI
Follow the Data Foundations learning path (Beginner to Advanced).