Once you sign in, your details will show here.
Knowledge Hub
+ New Topic
Filter (2)
Sort
9 topics · Data Modeling and Design · Beginner · 9 shown
Show allEvery topic is free to read. A free account also lets you search the topics, react to a topic and comment under it.
- I Am Datapedia!
Data Foundations
What is an Entity?
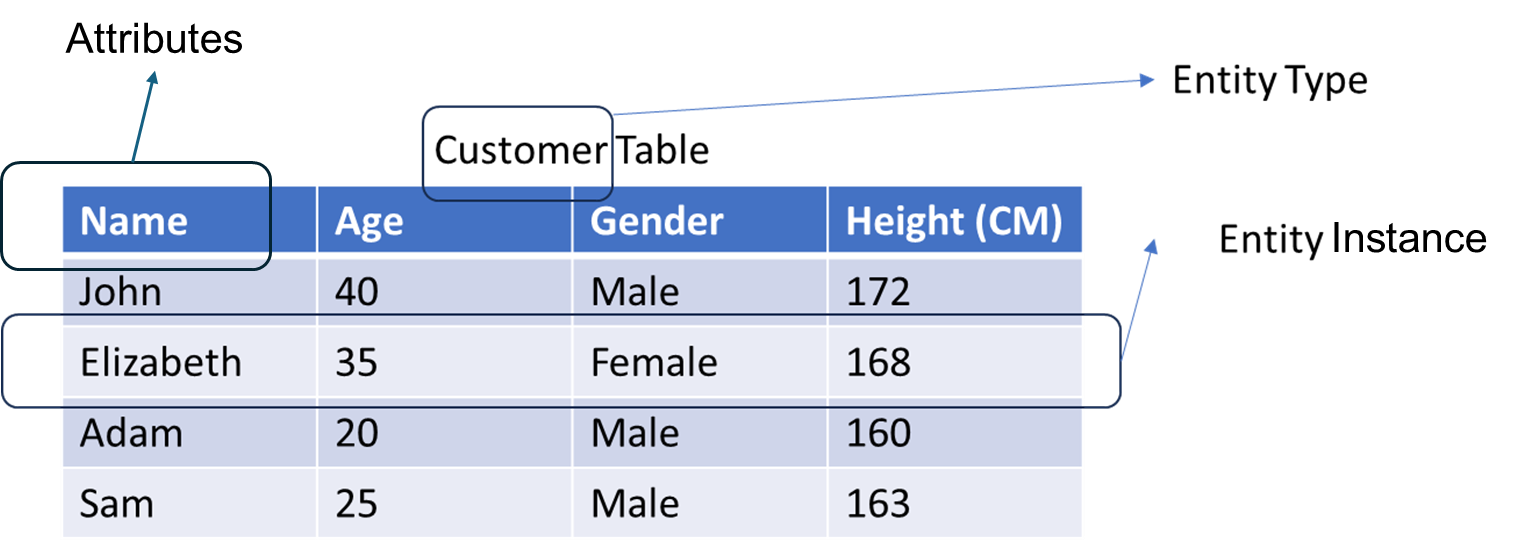
In the world of data and databases, the term entity is foundational yet often misunderstood. To build reliable data systems, it is essential to understand what an entity is and how it is structured. This chapter explores the concept of an entity and breaks it down into its three core components: Entity Type, Entity Attributed and Entity Instance.
Let’s decode it.
What Is an Entity?
An entity is anything that can be uniquely identified and described. In data modelling, an entity typically refers to a real-world object, person, concept, or event that holds relevance within a system, such as a student, a book, or a transaction.
Entities are the fundamental building blocks of structured data models. To model and manage them effectively, we categorize entities into two levels:
- Entity Type: the blueprint or template
- Entity Attribute: the properties
- Entity Instance: the real-world, data-filled object
1. Entity Type – The Blueprint
4 min readMore
- I Am Datapedia!
Data Foundations
Tables, Columns and Rows
Table, Column and Rows are one of the most basics of Data World but it’s worth explaining.
Let’s try to understand with an example, let’s say family is a table, how? Consider, you have 6 members in your family i.e., Grandfather = 1, Grandmother = 1, Father = 1, Mother = 1, Son = 1, Daughter = 1
Above is a standard average traditional family for most of us. Now, each of above members will have Name, Relationship and Date of Birth, right? These details or information are called properties and attributes of each family member and are called Columns or Fields in a table.
Now, when we say Name of the eldest person in family is John, his relationship in family is Grandfather, and his Date of Birth is 1st January 1950. These details or information about one person in a family is called a Row.
Same way, when we have details or information about all the family members, we can say, we have multiple rows.
1 min readMore
- I Am Datapedia!
Data Modeling and Design
Primary and Foreign Keys
Primary Key is also known as Pkey, and Foreign Key is also known as Fkey. These are one of the most important terms without which a proper Data Model cannot be created.
We have understood what a table is. Now, the next step is to understand, if there is more than one table then how to join both. In the topic ‘Tables, Columns and Rows’ we used an example of table ‘Family’. Let’s use the same table here with an additional column i.e., Birth Location.
Table Name: Family
Now let’s say, to save space in Family table as we can see ‘United State of America’ has been used many times so how about creating another table where let’s store lengthy country names and in Family tables, let use country code instead with there is another table called as Birth Location.
Table Name: Birth Location
Now, let’s update the Family table to reflect country code instead of country name.
Table Name: Family
Now, the problem is column ‘Birth Location’ have country code so how to find out which country name refer to ‘001’. Let’s declare ID in Birth_Location table as Pkey and Location_ID in Family table as Fkey.
2 min readMore
- I Am Datapedia!
Data Modeling and Design
Data Modelling
Data Modelling is the practice of structuring, describing, and organizing information so it reflects real-world entities, relationships, rules, and contexts in a way that supports business operations, analytics, governance, and AI (Artificial Intelligence).
Most of us, are aware of only few Data Modelling techniques, but in reality, there are around 37 of those, shown in below diagram.
Data Modelling Concepts & Techniques
I will try not to go into details in this topic, as we will have separate topics for each of it. First, one must understand the concept of Normalization and Denormalization to get a grasp of data modelling world.
De-normalization: Surely, all of us has worked on Excel. Excel has columns and rows, as do tables in Databases. Consider having employee details in Excel with columns like employee ID, name, mobile number, address, salary, department etc. All this information related to one employee can be stored in one row which is a Denormalization data model.
3 min readMore
- I Am Datapedia!
Data Warehousing and Business Intelligence
WHAT IS A FACT Table?
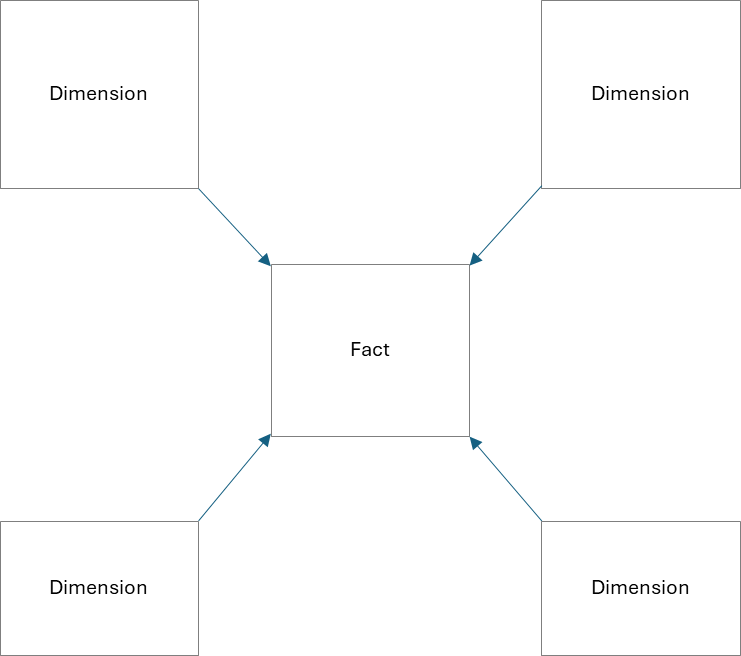
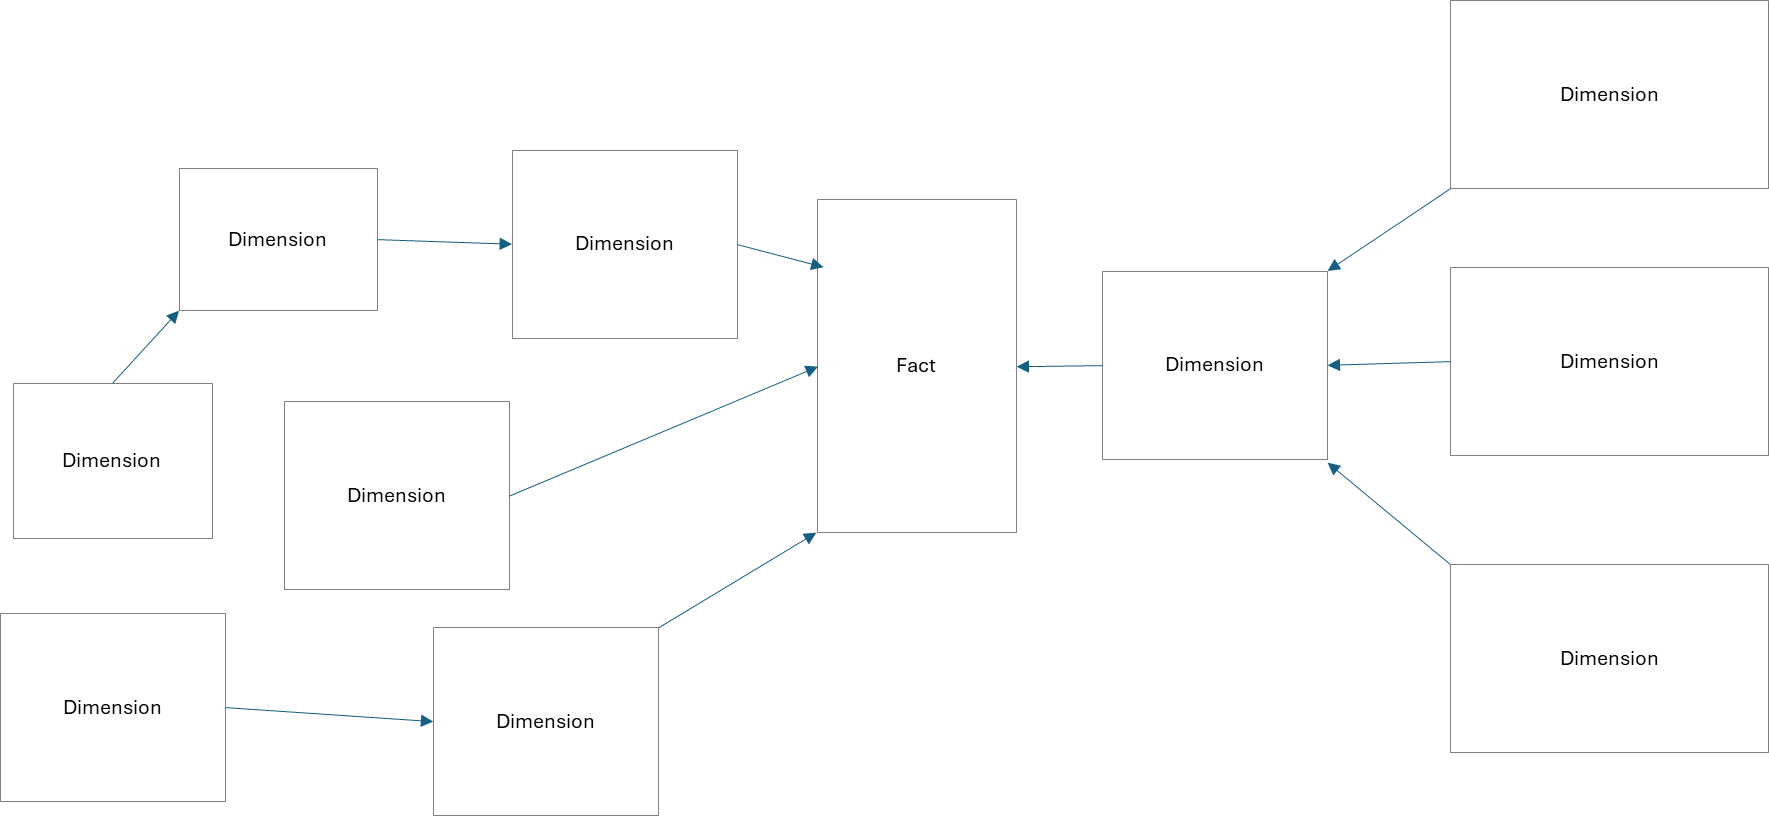
A Fact is the central table in dimensional data modelling that stores the measurable outcomes of a business process. These measures are typically numeric and are designed to be aggregated, analysed, and reported across multiple perspectives provided by dimension tables.
The primary goal of a fact table is to capture business events in a structured format that supports performance analysis and decision-making. Facts answer the question: “What happened?” They represent transactions, events, or measurable states that the organization wants to analyse.
A fact table typically contains:
- Numeric measures (e.g., LoanAmount, ApprovalCount, RepaymentAmount)
- Foreign keys to dimension tables (e.g., Customer_ID, Officer_ID, Branch_ID, Time_ID)
- Minimal descriptive attributes of its own
For example, in a loan approval environment, a Fact_LoanApproval table may contain:
- Loan_ID (Primary Key)
- Customer_ID (Foreign Key)
- Officer_ID (Foreign Key)
- Branch_ID (Foreign Key)
- Time_ID (Foreign Key)
- LoanAmount
- InterestRate
- ApprovalFlag
3 min readMore
- I Am Datapedia!
Data Warehousing and Business Intelligence
WHAT IS A DIMENSION Table?
A Dimension is a descriptive table in dimensional modelling that provides context to fact tables. While facts record measurable events, dimensions explain those events by supplying descriptive attributes such as names, categories, locations, and time periods. Dimensions answer questions such as who, what, when, where, and sometimes how.
The primary goal of a dimension is to make numeric measures meaningful and interpretable. Without dimensions, numbers such as LoanAmount or ApprovalCount would lack business relevance. Dimensions provide the language that business users understand.
A dimension table typically contains:
- A primary key (e.g., Customer_ID, Officer_ID, Branch_ID, Time_ID)
- Descriptive attributes (e.g., Name, Segment, Region, ExperienceYears)
- Hierarchies for reporting (e.g., Day → Month → Quarter → Year)
For example, in a loan approval data warehouse:
- Dim_Customer may include CustomerID, Name, AgeGroup, IncomeBand, Segment.
- Dim_Officer may include OfficerID, Name, Branch, ExperienceYears.
- Dim_Branch may include BranchID, City, Region.
- Dim_Date may include DateID, Day, Month, Quarter, Year.
3 min readMore
- I Am Datapedia!
Data Modeling and Design
Data Cardinality
This is a normal term for database modelers, but business users are not very familiar with it. Understand this and it will solve your 90% data problems. Don’t have good Data Model and you must deal with Chasm and Fan Traps.
Data Cardinality is about maintaining the level of details in a table. There are 2 types of Data Cardinality.
- High Cardinality: It is when there are no or less duplicates in a table. Tables with Pkey are mostly in Highest Cardinality mode.
- Low Cardinality: It is when there are high number of duplicates in a table. Tables with Fkey are mostly in Low Cardinality mode.
For example, Product table with details like Product ID, Product Name, and Product Manufactured Date etc. It can contain hundreds of products, but at the same time, a particular product cannot be repeated as it’s already in the table right. So, now we can say this table has High Cardinality. Referring to the same example if Product is there then one must sell it too. Sales of the products can be stored in a Sales table. Now, 1 type of product can be sold many times right. So, Sales tables can contain thousands of rows where hundreds of rows can be for 1 product means Product ID will be repeated in this Sales table so we can say this table is in Low Cardinality with respect to Products.
3 min readMore
- I Am Datapedia!
Data Storage and Operations
Views
Views are fundamental in the world of data, serving as a foundational concept. Although it may seem basic, understanding views is crucial as we will delve into more advanced topics such as Materialized Views and External Tables.
Let's break it down...
In the realm of databases, we are familiar with tables, structured with columns and rows, each representing a specific dataset post-normalization (a topic we'll cover separately). Examples include tables for employees, departments, and salaries.
Now, imagine the need to combine information from these tables, like obtaining a comprehensive view of a customer's department and salary. To achieve this, we would typically construct a query that involves joining these tables, providing us with a consolidated result.
However, if we find ourselves running this query frequently, perhaps on a daily or monthly basis, creating a "view" becomes advantageous. A view allows us to encapsulate the query and, when needed, execute a simple SELECT command on the view to retrieve the combined results from the employee, department, and salary tables.
2 min readMore
- I Am Datapedia!
Data Modeling and Design
Graph
A Graph is a way to show connections between things. It is made up of dots, called vertices (or nodes), and lines, called edges (or links), that connect the dots. Graphs help us understand relationships between objects and are used in many areas like computers, biology, and social studies.
Important Terms in Graphs
- Vertices and Edges
- Vertices (Nodes): These are the basic points in a graph. ‘One node is called Vertex whereas Multiple nodes are called Vertices.’
- Edges (Links): These are the lines connecting the points.
- Types of Graphs
- Undirected Graph: The edges don’t have a direction, meaning the connection works both ways.
- Directed Graph (Digraph): The edges have a direction, shown by arrows.
- Weighted Graph: The edges have values or weights, like distance or cost.
- Simple Graph: There are no loops (lines starting and ending at the same point) or duplicate edges.
- Complete Graph: Every point is connected to every other point.
Bipartite Graph: The points are split into two groups, and lines only connect points from different groups.
2 min readMore
- Vertices and Edges
Build a strong foundation in Data & AI
Follow the Data Foundations learning path (Beginner to Advanced).